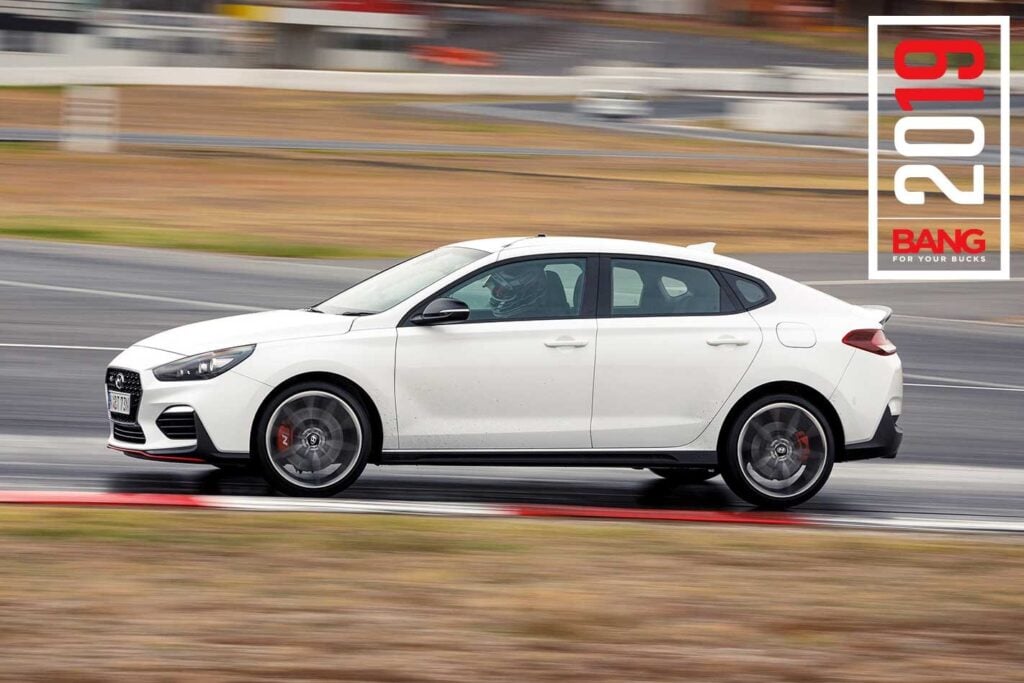
Your twenty-first. In America, according to every documentary I’ve seen, it’s a licence to cause booze-fuelled mass destruction of your parents’ house. Closer to home, the rite of passage is a carton of tinnies and a snooze under a bridge with a goon bag for a pillow.
MOTOR’s ripper stalwart event Bang For Your Bucks turns 21 this year and it’s been decidedly less riotous. In fact, it’s been pretty laid-back. Business as usual, but instead, with 22 cars cracking their knuckles to take on our famous spreadsheet, the event is healthier, busier and bigger than ever.
But suppose this is the first time you’ve picked up a copy of MOTOR and Bang For Your Bucks sounds to you like the name of a fireworks store in a back-suburb of Canberra. Well, prepare for the lowdown. (And if you need more than two hands to count how long you’ve been reading MOTOR, you could probably use this opportunity to skip through a few paragraphs.)
MOTOR has four events each year. One, the annual Tyre Test finds the best performance tyre on sale in Australia. In fact, in all of the southern hemisphere we know of, it’s the only performance tyre test where someone actually gets a pro driver, and a car, and books a track, and goes out and does the testing.
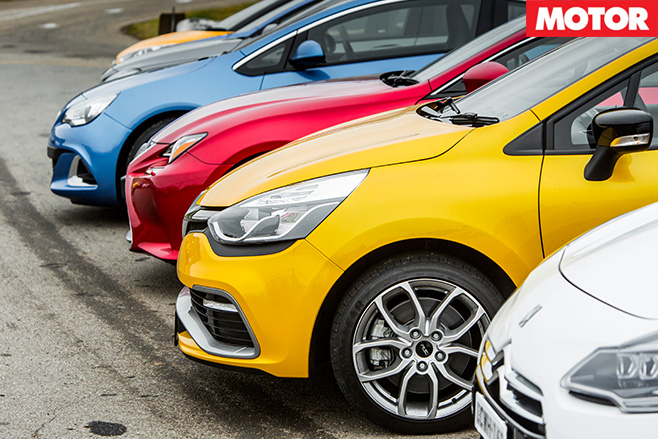
Performance Car of the Year is MOTOR’s blue riband event (yes, that’s how you spell blue riband). PCOTY takes the top 10 performance cars of the year by way of road, track and drag testing and combines subjective judging to name the best fast car of the year.
The difference between PCOTY and Bang is the price. Bang For Your Bucks names the best-value performance car on sale today, up to $100,000. It was open-slather, price-wise, up until 2007, when we stopped sending invitations to Porsche Boxsters, GT-Rs and M3s and bolted in the price ceiling, to focus on the cars that were at least half-attainable to those with mortal finances.
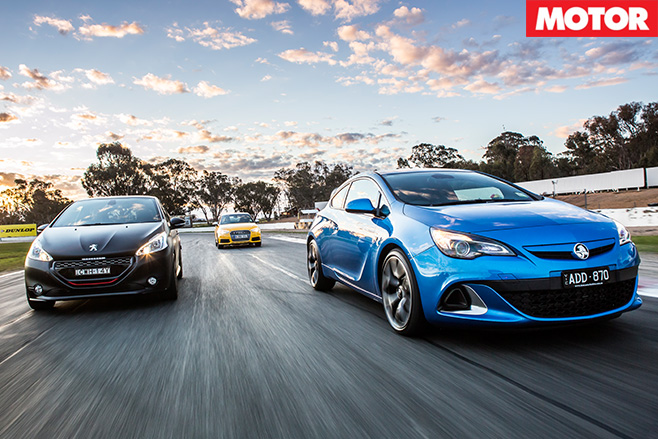
But price cap or not, the Bang trophy, as you’ll see in our Honour Roll table, has reliably rewarded the fast and the cheap. In the early 90s it darted around unpredictably before entering the WRX era, punctuated by HSV’s sole event win in 2000, before SS Commodores starting getting in the pocket-rocket Jap cars’ way. There’s been a few oddburger winners, too, as you’ll notice.
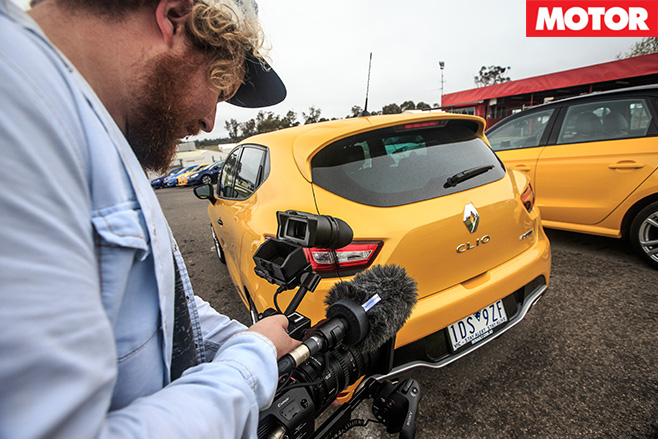
So what makes a car eligible? It must cost under $100K and be a totally new model, or at least have reasonable mechanical updates, or a significant price drop – anything, really, that would make a meaningful impact to its Bang For Your Bucks score compared to past years.
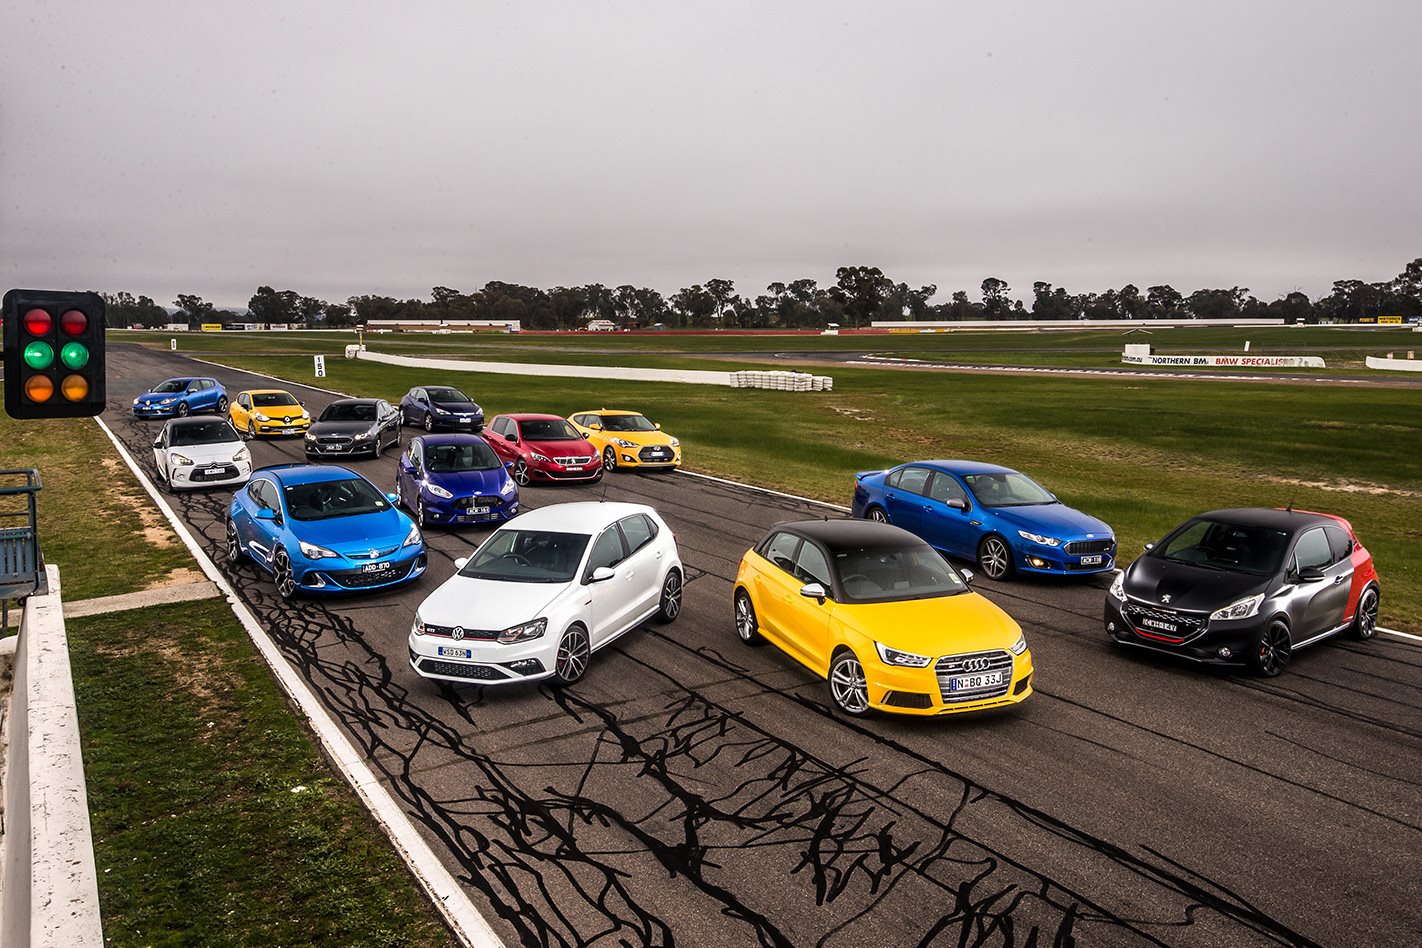
Our wish list written, we send out the invitations to the car manufacturers. We book a track – this year, same as last, Winton Motor Raceway in northern Victoria – and book photographers, videographers, journalists, racing drivers… trust us, it’s a circus.
Now, the thing is, not every car manufacturer accepts our invitation, or has a car that it can give us.
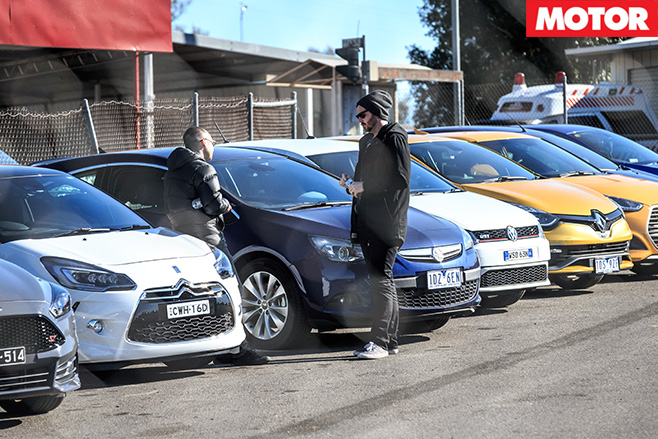
Twenty two cars have fronted up to Bang this year, and the field ranges from wild 335-but-actually-over-400kW V8 Falcons and stripped-out Megane RS275 Trophy-Rs to aspiring new performance machines like the Veloster Turbo. Then there are brand new bullets like Audi’s TT, which really did surprise us, and the monster Golf R is back, too.
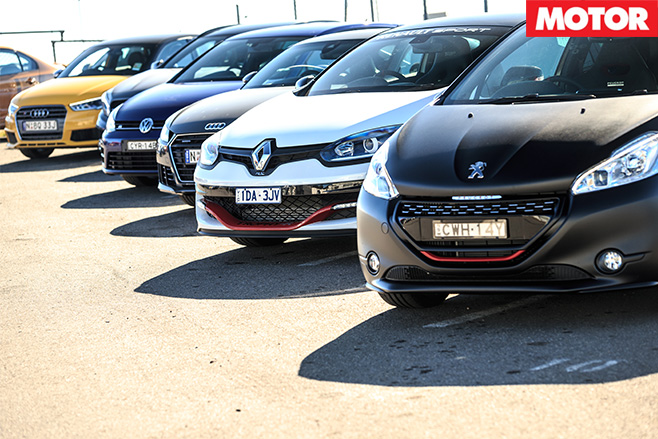
Now, to the cars we invited that couldn’t come. Would’ve loved a 4C, and Alfa Romeo had one, but a journalist crashed it. Given the XR6 Turbo Ute’s outright win in 2008, we asked for a Ute this year, but Ford sent a sedan instead. All good, happy to have it, but the higher price, and no extra speed, will hurt it.
Meanwhile Holden didn’t have any Insignia VXRs for us yet, and same as last year, HSV didn’t want to participate because, well, actually they didn’t give a reason. Lotus just never got back to us about an Elise, and the storming MINI JCW wasn’t available when we did our testing. Apart from those cars, everything else eligible was available.
It’s good we’re back at Winton. If we did this at Phillip Island, it’d be fun but the higher horsepower, higher grip cars would have an unfair advantage over the cars not-so-talented in those areas. Likewise, if we did this at Wakefield Park, or the Haunted Hills hillclimb circuit, the opposite could be the case.
Winton is a fair and level playing field because it rewards power with its mix of straights, medium-speed corners, the sweeper, hairpins and a few long corners where our gun driver can lean into a car’s chassis and tyres.
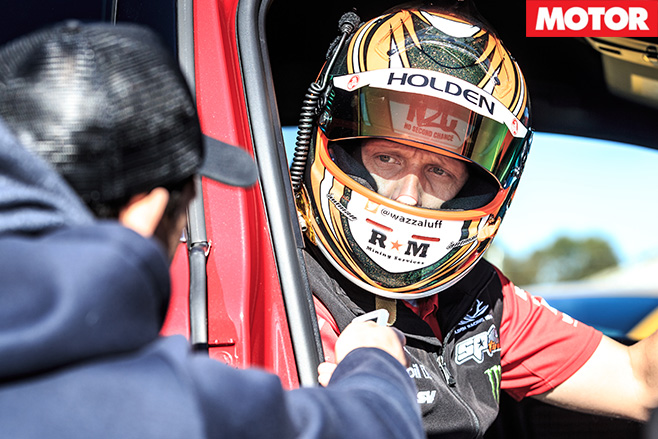
And just lastly, we need to bang on about how important Bang For Your Bucks is. Yes, we sound like Ronald McDonald trying to flog you a Fillet-o-Fish, but we can’t think of any other media outlet that books a track, a panel of experts and a gun driver to do old-school nitty-gritty testing like this. Bang For Your Bucks has been around so long because the formula works, the results are on-the-money and people trust it. We trust it. Now, if we can get a hip-hip and a hooray for our birthday event, with that out of the way, let’s get cracking.
The Formula explained
How does this infinitely mysterious Bang For Your Bucks formula work? Fairly mind-bending mathematics, that’s how. Beware, this isn’t light reading. And we didn’t even include all of the maths and equations.
But when you absorb it, think about it, and it clicks, it all makes sense, because the whole thing is rooted in common sense. And actually, it’s quite clever, almost elegant, in how it determines the final finishing order.
One thing’s for certain, in crunching an enormous amount of as-tested performance data, it’s unbelievably fair, particularly as the scores are divvied about based on exact indexed data (rather than just handing out scores based on rank).
So the Bang For Your Bucks index is actually two indexes combined – a Bang index, drawn from performance data and judges’ rankings. And a Buck index, drawn from price. The Bang For Your Bucks index is 60 per cent Bang, 40 per cent Buck, to give a 100 per cent indication of just how good value a performance car really is.
THE BANG INDEX
First, let’s explain the Bang index. We factor in as-tested data from nine performance disciplines. They are Lap Time, 0-400m, 0-100km/h, 80-120km/h, 0-400m Top Speed, Lap Top Speed, Apex Speed from turn five, Apex Speed from turn nine, and 100-0km/h.
Obviously 0-400m, 0-100km/h, 80-120km/h give a pretty solid indication of a car’s accelerative performance, while the Top Speeds give an indication of raw grunt. 100-0km/h covers off a car’s stoppers, while the Apex Speeds speak of grip. The Lap Time obviously combines them all.
Of course, a risk here is that the order is based purely on speed. A car might be fast, but it might also be boring or frustrating to drive at speed. That’s why performance data is 80 per cent – the other 20 per cent is drawn from the judges’ subjective rankings.
Meanwhile, that subjective scoring criteria is simply what the data can’t account for: the fun and engaging factor.
Warren Luff and Scott Newman gather the accelerative and braking performance data using our super-accurate Driftbox testing equipment. Meanwhile the Lap Time stuff is left to Luffy, Australia’s best driver for testing road cars on racetracks.
With the data collected and back in the office, this is where it gets complicated.
We have a Microsoft Excel spread-sheet full of precise formulas refined by Australia’s most experienced motoring journalists and road testers over a 20-year period. And so with the care of a neurosurgeon, the data goes in. And the results are spat out.
The Bang index is based on an equation applied to each of those nine performance disciplines. It seems befuddling at first glance, but when it clicks, it makes perfect sense.
In the $0-$50K class there are 14 cars scored for each of the nine disciplines. The worst car gets 1.000, the best car, 14.000. The greater the score, the better.
But simply because it’s the fairest and most accurate way, we scale the score based on the spread of performance data (rather than just handing out scores of one, two, three, etc, based on the finishing order). Why? Well, what if the first 12 cars all did laps between 1:42 and 1:43, and some Tail End Charlie did a 1:53? It wouldn’t be fair, or make much sense, to spread the points evenly if the spread of lap times was anything but.
We had included here an example of how we score a car, but it went on for a bit. Instead we’ll publish to our website a detailed example of a car going through the formula. Mathophiles keep your eyes peeled. But for now, we’ve only got 148 pages to work with, so you’ll just have to trust us – the maths is sound.
THE BUCKS INDEX
Fortunately the Bucks index value is much easier to determine. Of all the 13 cars, the average price is $35,152. How far above or below a competitor car sits, determines its value on the Bang index.
THE BANG FOR YOUR BUCKS INDEX
Now we need to factor in 60 per cent of a given car’s Bang index, and 40 per cent of its Bucks index. When you’ve done this, you get a final number – your Bang For Your Bucks score.
And there you have it.
Don’t say we didn’t warn you.

