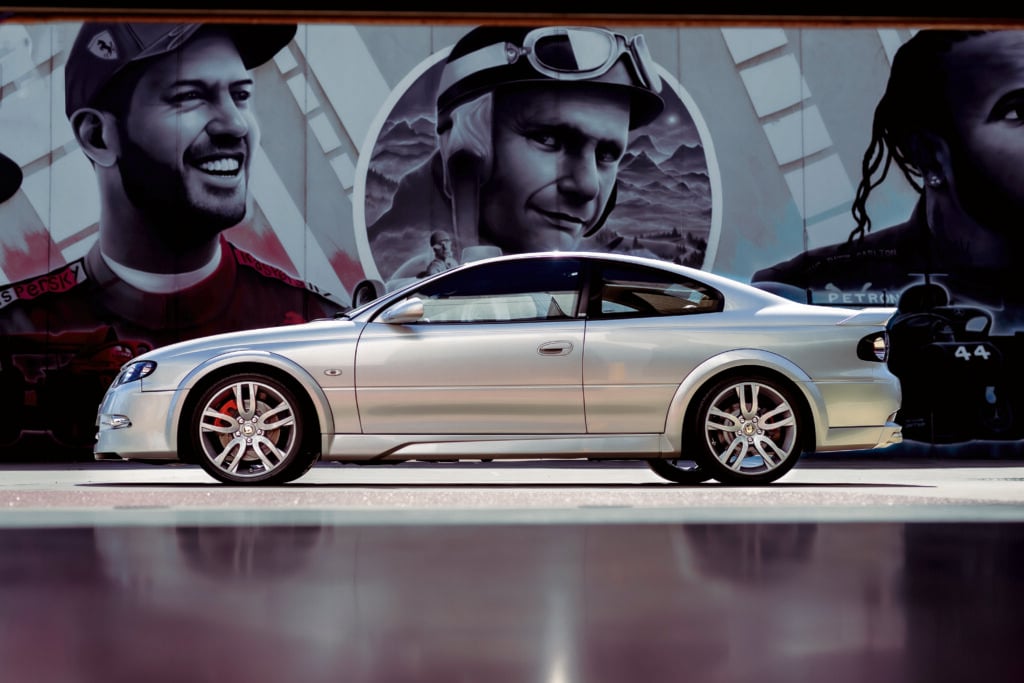
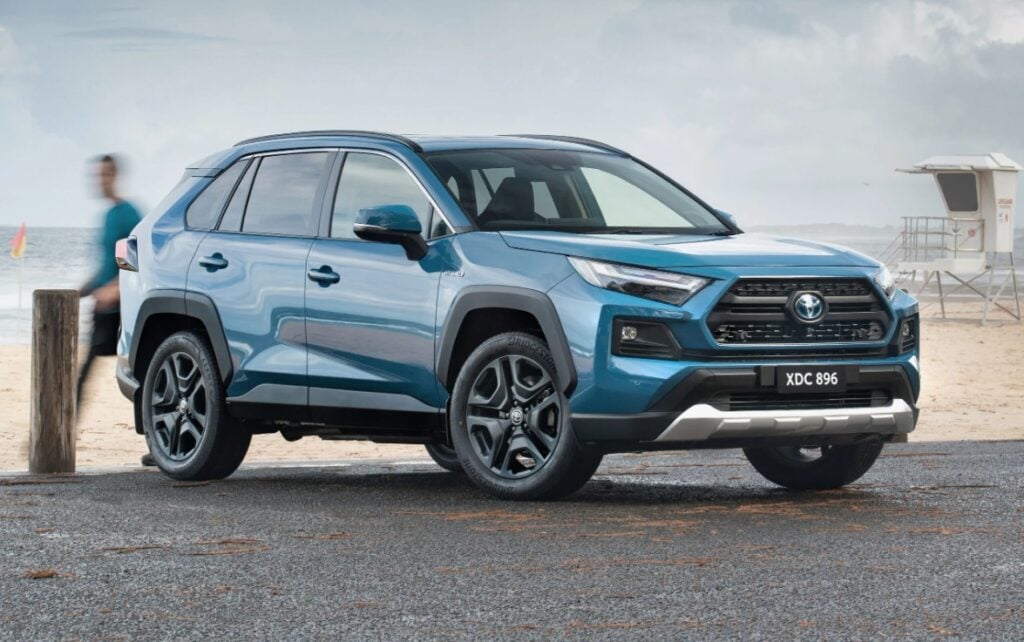
On face value it seems a lopsided contest – take an example each of Holden and Ford V8 Supercars and compare them with their distantly related donor vehicles, in this case two cars apiece from Aussie performance maestros, FPV and HSV.
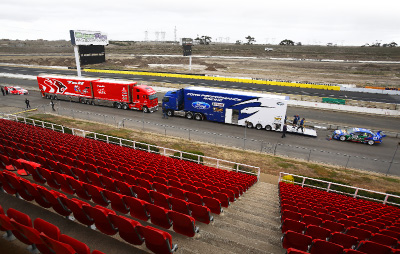
Not only are we talking purpose-built racing cars versus road cars – the latter designed with the inherent compromises required to ensure reliability while operating in a wide range of driving conditions – we’ve taken them to a race track for the exercise. In terms of home-ground advantage, it’s like pitting a hamster against a racehorse at Flemington.Of course, if all this test came down to was lap times and V8 thunder, then we could put down the glasses now, as the V8 Supercars have their road-based relatives well and truly covered on both fronts. But, being a tad pointy headed, we wanted to dice the data more finely than a mere lap time. Which is how we found ourselves standing in the pit lane of Calder Park one fine morning, flanked by a half-dozen cars, two transporters and a bunch of helpers.Among the scrum were two familiar faces in HRT’s Garth Tander and FPR’s Steve Richards, invited along to hammer out the hot laps in their respective race cars. Somewhere in a flight case nearby lay a data recorder that would soon earn its stripes logging lap times, corner speed, braking markers, braking forces and top speeds. There, too, was Wheels’ trusty Vbox, destined to measure acceleration of 0-100km/h, standing 400 metres, and 80-120km/h, and, this time, 120-160km/h.We also asked the pro drivers to provide their subjective appraisal on the relative merits of all cars driven.So, would it be the expected walkover by the purpose-built V8 Supercars, or would our data fest burp up some surprises? Read on…THE TESTS Twenty-two hundred kilowatts (that’s 3000bhp), split six ways, and one empty Calder Park circuit is a ‘pinch yourself’ day’s work — eight hours of fun with things that are fast and loud.Acceleration The Wheels Vbox, powered by GPS and piloted by Hawley, recorded the straight-line speed tests. The road cars were also driven by Hawley for the sprint tests. The race cars were steered by their respective pilots. It should be noted that a recent drag-racing event had made Calder’s front straight extremely slippery. As a result, all standing start acceleration data is 0.2-0.5-seconds slower than we’ve either previously recorded or were expecting from the race cars. The data, however, remains relative.Braking The peak G-force generated was simultaneously documented as was the average deceleration in the braking zone (again displayed as a G-force reading).Lap Based The pros cut two laps in each car (ESP off in the road cars except for one set in the F6 for comparison). The laps were logged by an AX-22 data logger, which uses GPS and a two-axis accelerometer to map the unit’s position 100 times a second. The data was downloaded and processed by Race Technology’s software, which then displays an accurate map of the track. We cut the track into ten sectors (main straight, turn one, etc), and subsequently assemble a best theoretical lap time for comparison with the best actual lap time.

