News

Gallery 4
Snapshot
- Most popular used cars in Australia revealed
- Ranger and HiLux top the charts u2013 is anyone surprised?
- Small cars changing hands quicker than SUVs
The new-car market has always been easy to gather data on with an industry body (the FCAI) dedicating its time to tracking sales figures. The second-hand market, though, has been more opaque.
The Australian Automotive Dealer Association (AADA) has teamed up with Australian company Autograb, which provides used car valuation and market tracking software, to reveal the best-selling used cars.
This data excludes vehicles older than 15 years and those that have been written off, so while it’s not as complete as the whole market, it gives a good indication of the most popular second-hand vehicles.
4
More than 65% of car sales occur in the used market, with 303,732 vehicles for sale (42.2% at dealers), and 206,417 sold (37.8% by dealers) in November.
Of the states and territories, ACT and NSW account for the most sales (when combined) followed by VIC, QLD, WA, SA, TAS, and the NT.
While there were more SUVs (125,055) for sale than passenger cars (110,390), 86,985 used passenger cars changed hands compared to 78,097 SUVs. Utes accounted for 35,064 sales in November.
Petrol was the dominant fuel source (135,141 sales) ahead of diesel (62,813) and hybrid (6755).
Battery-electric vehicles made up 1395 of November’s sales – though it’s worth pointing out that’s an increase of 6.7% compared to October when all other fuel sources (bar plug-in hybrids) lost share.
4
Top 10 best-selling second-hand cars
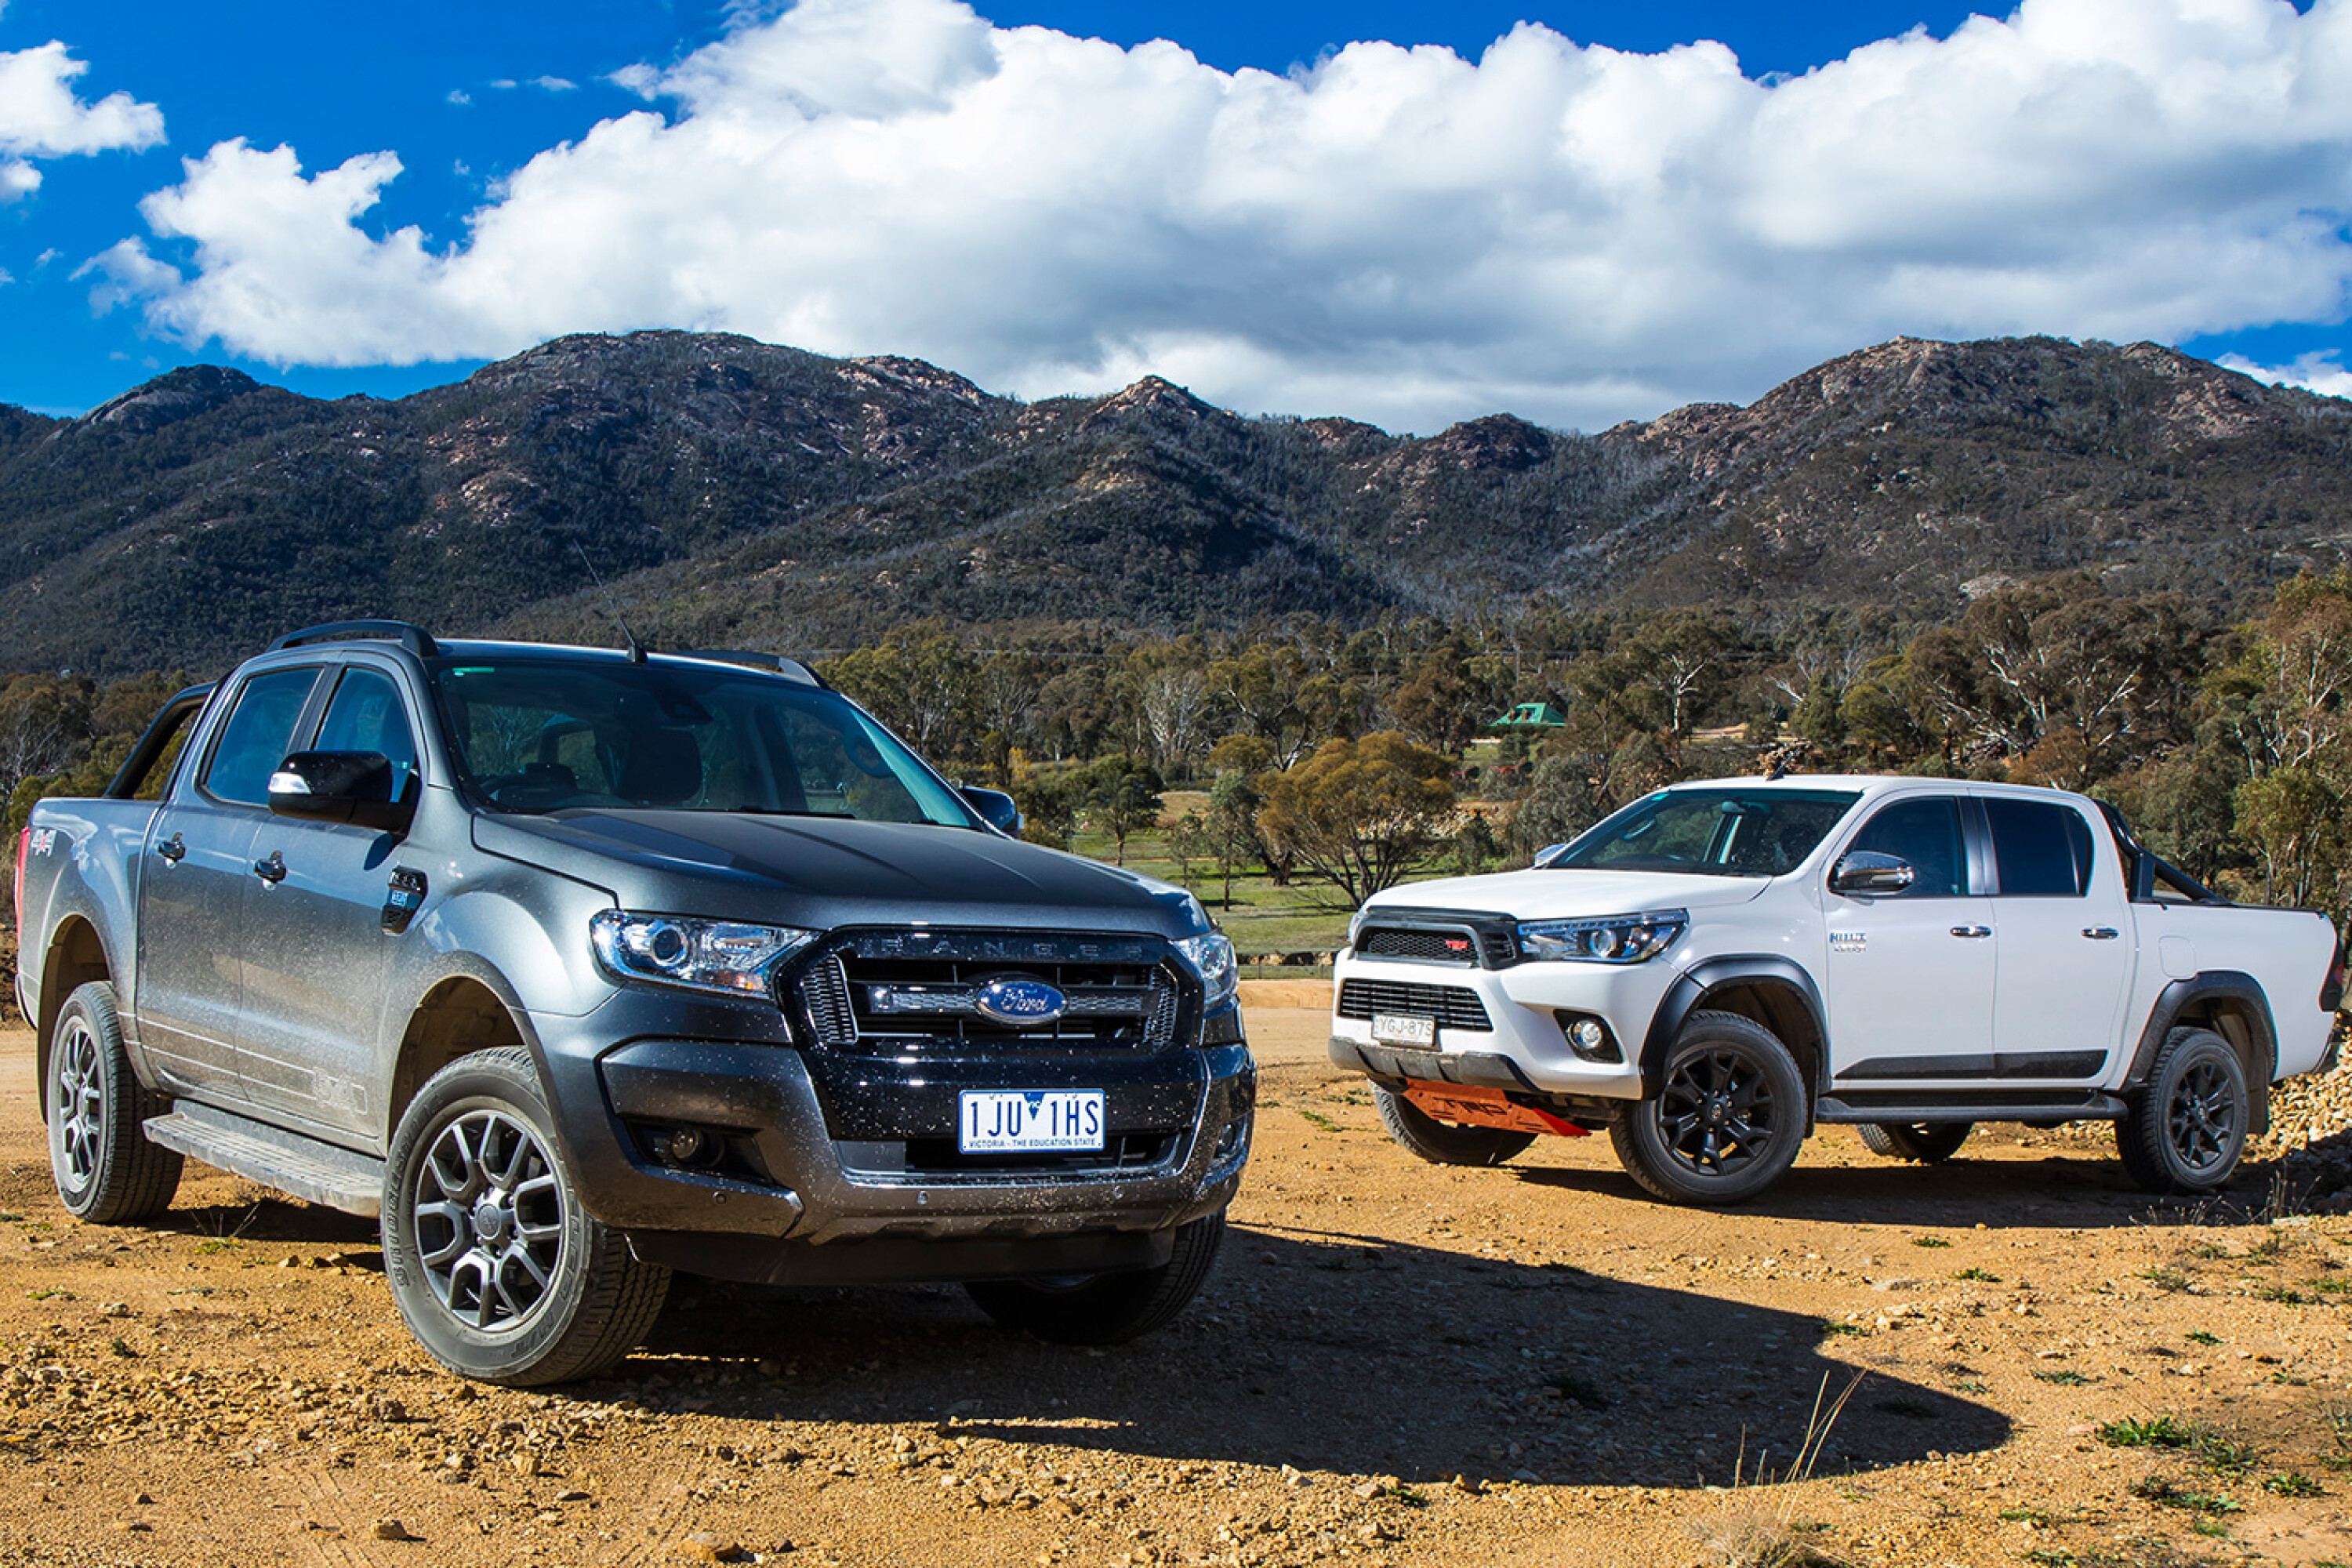
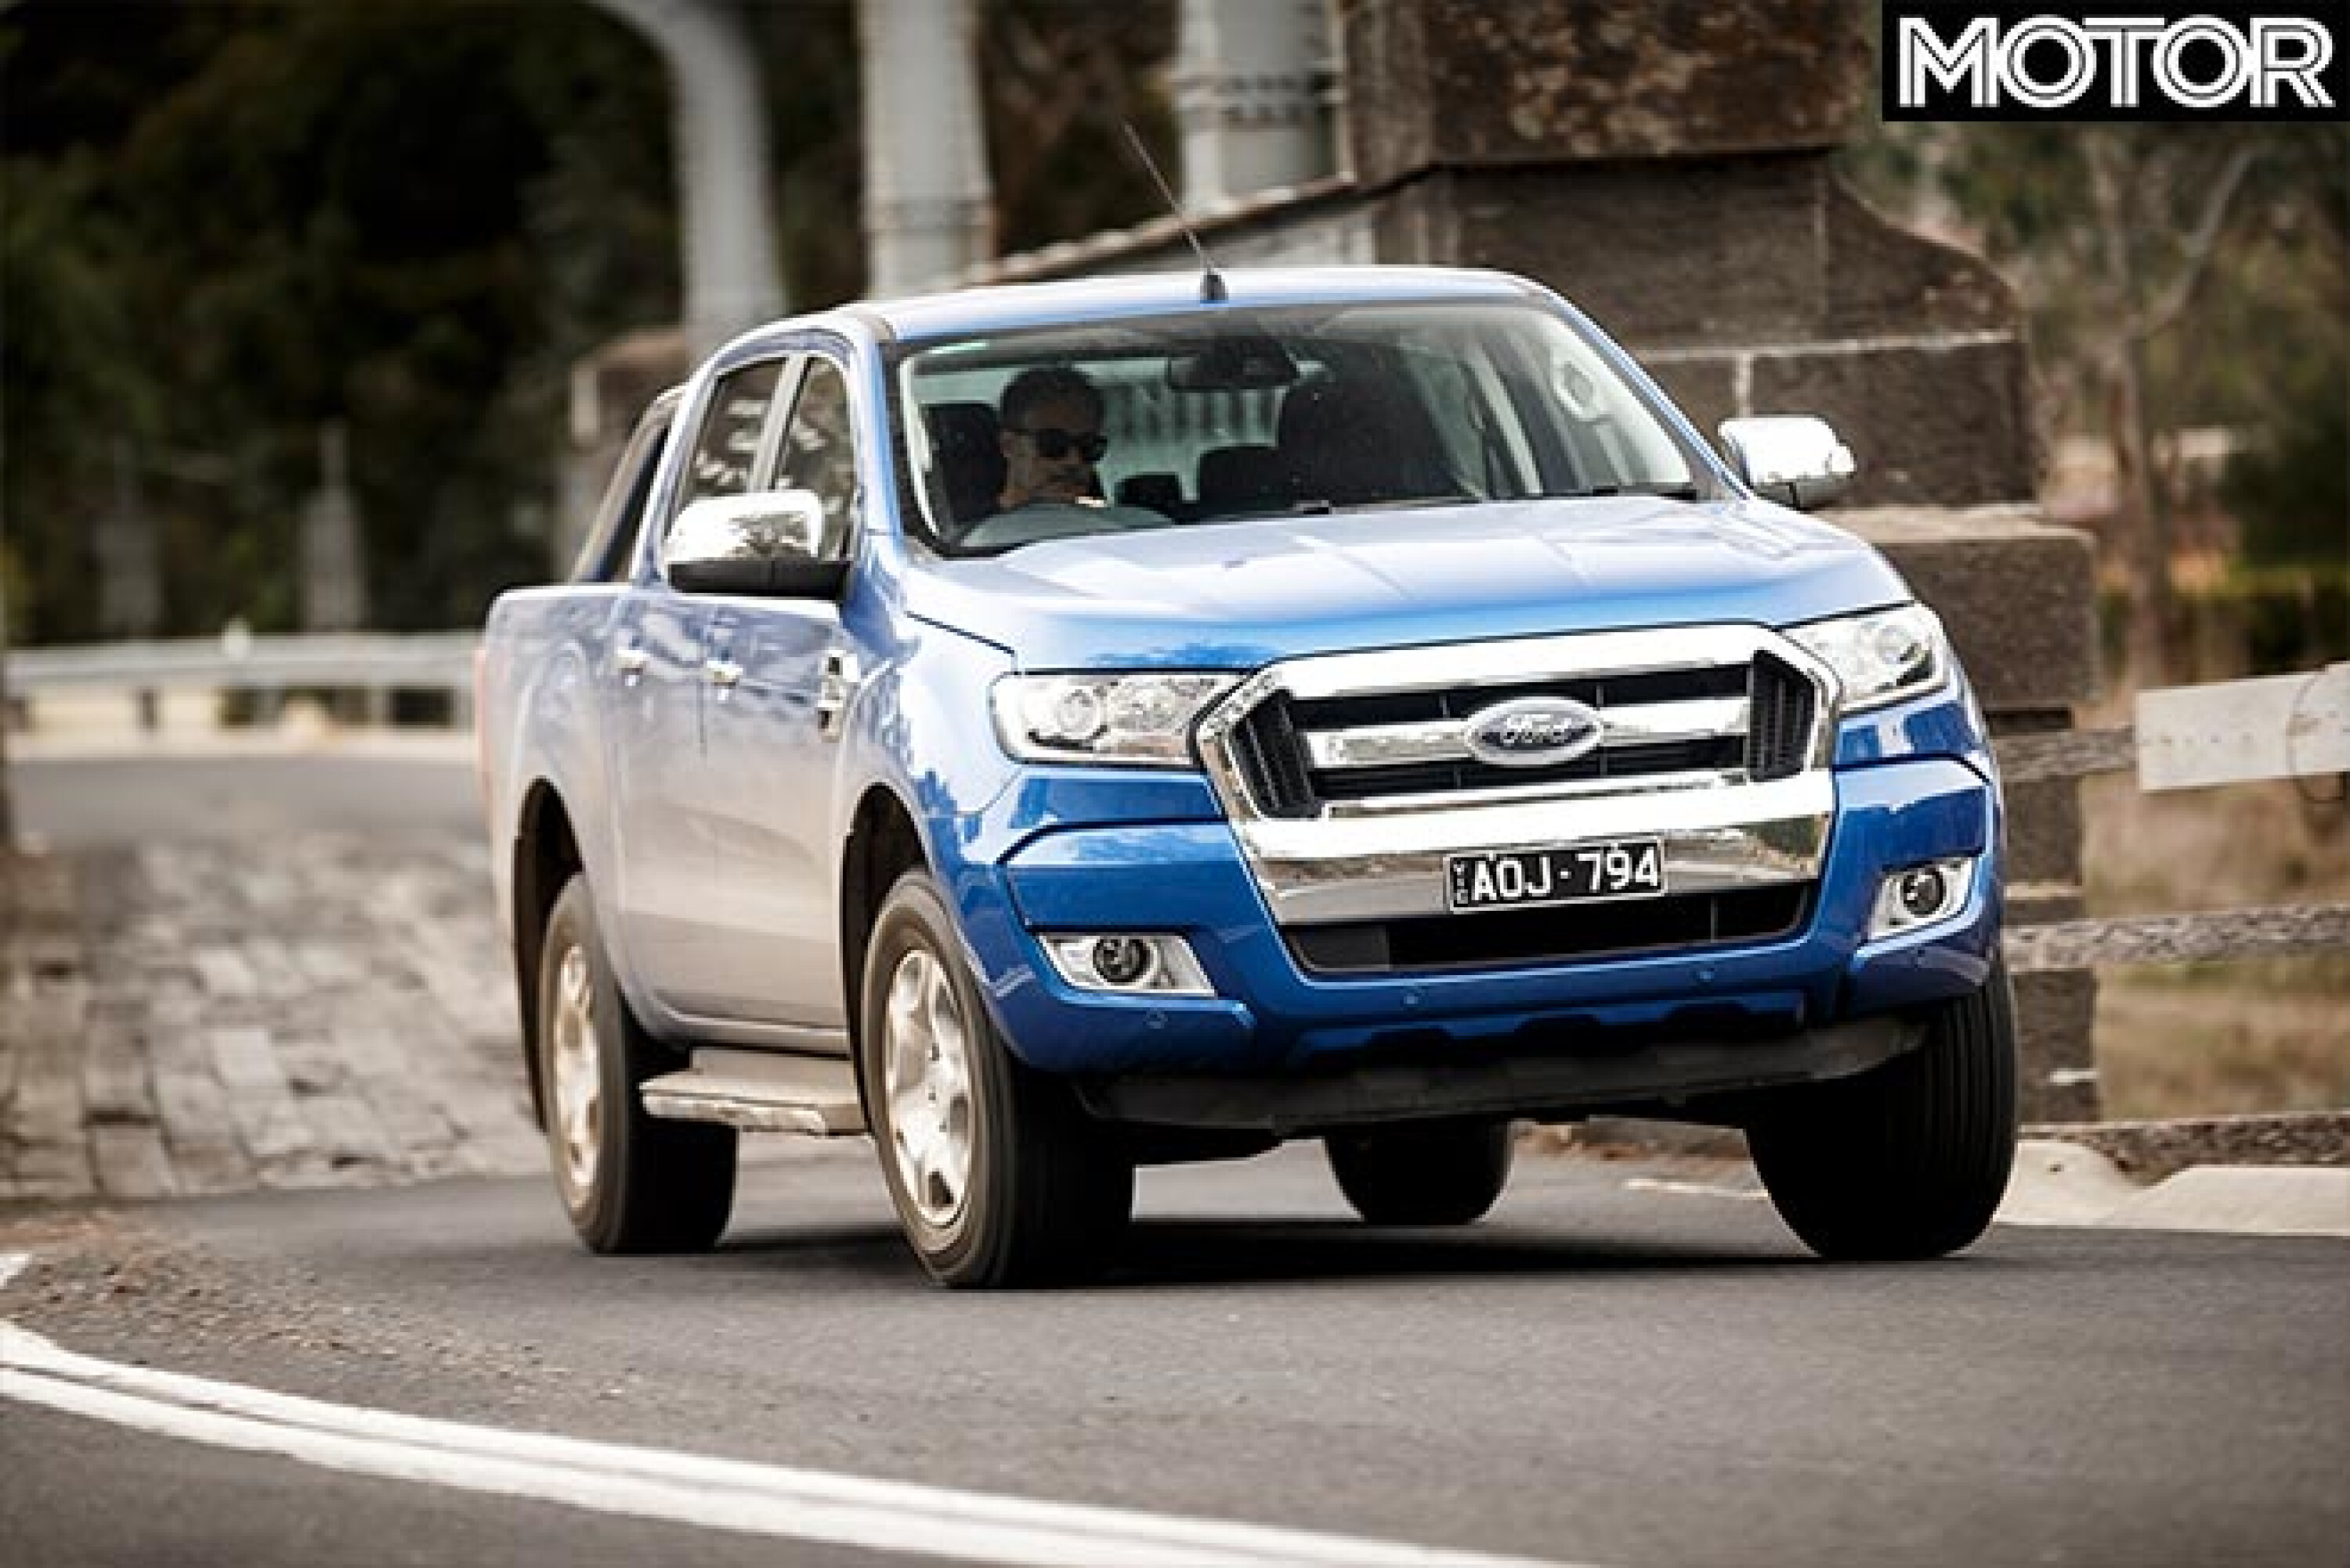
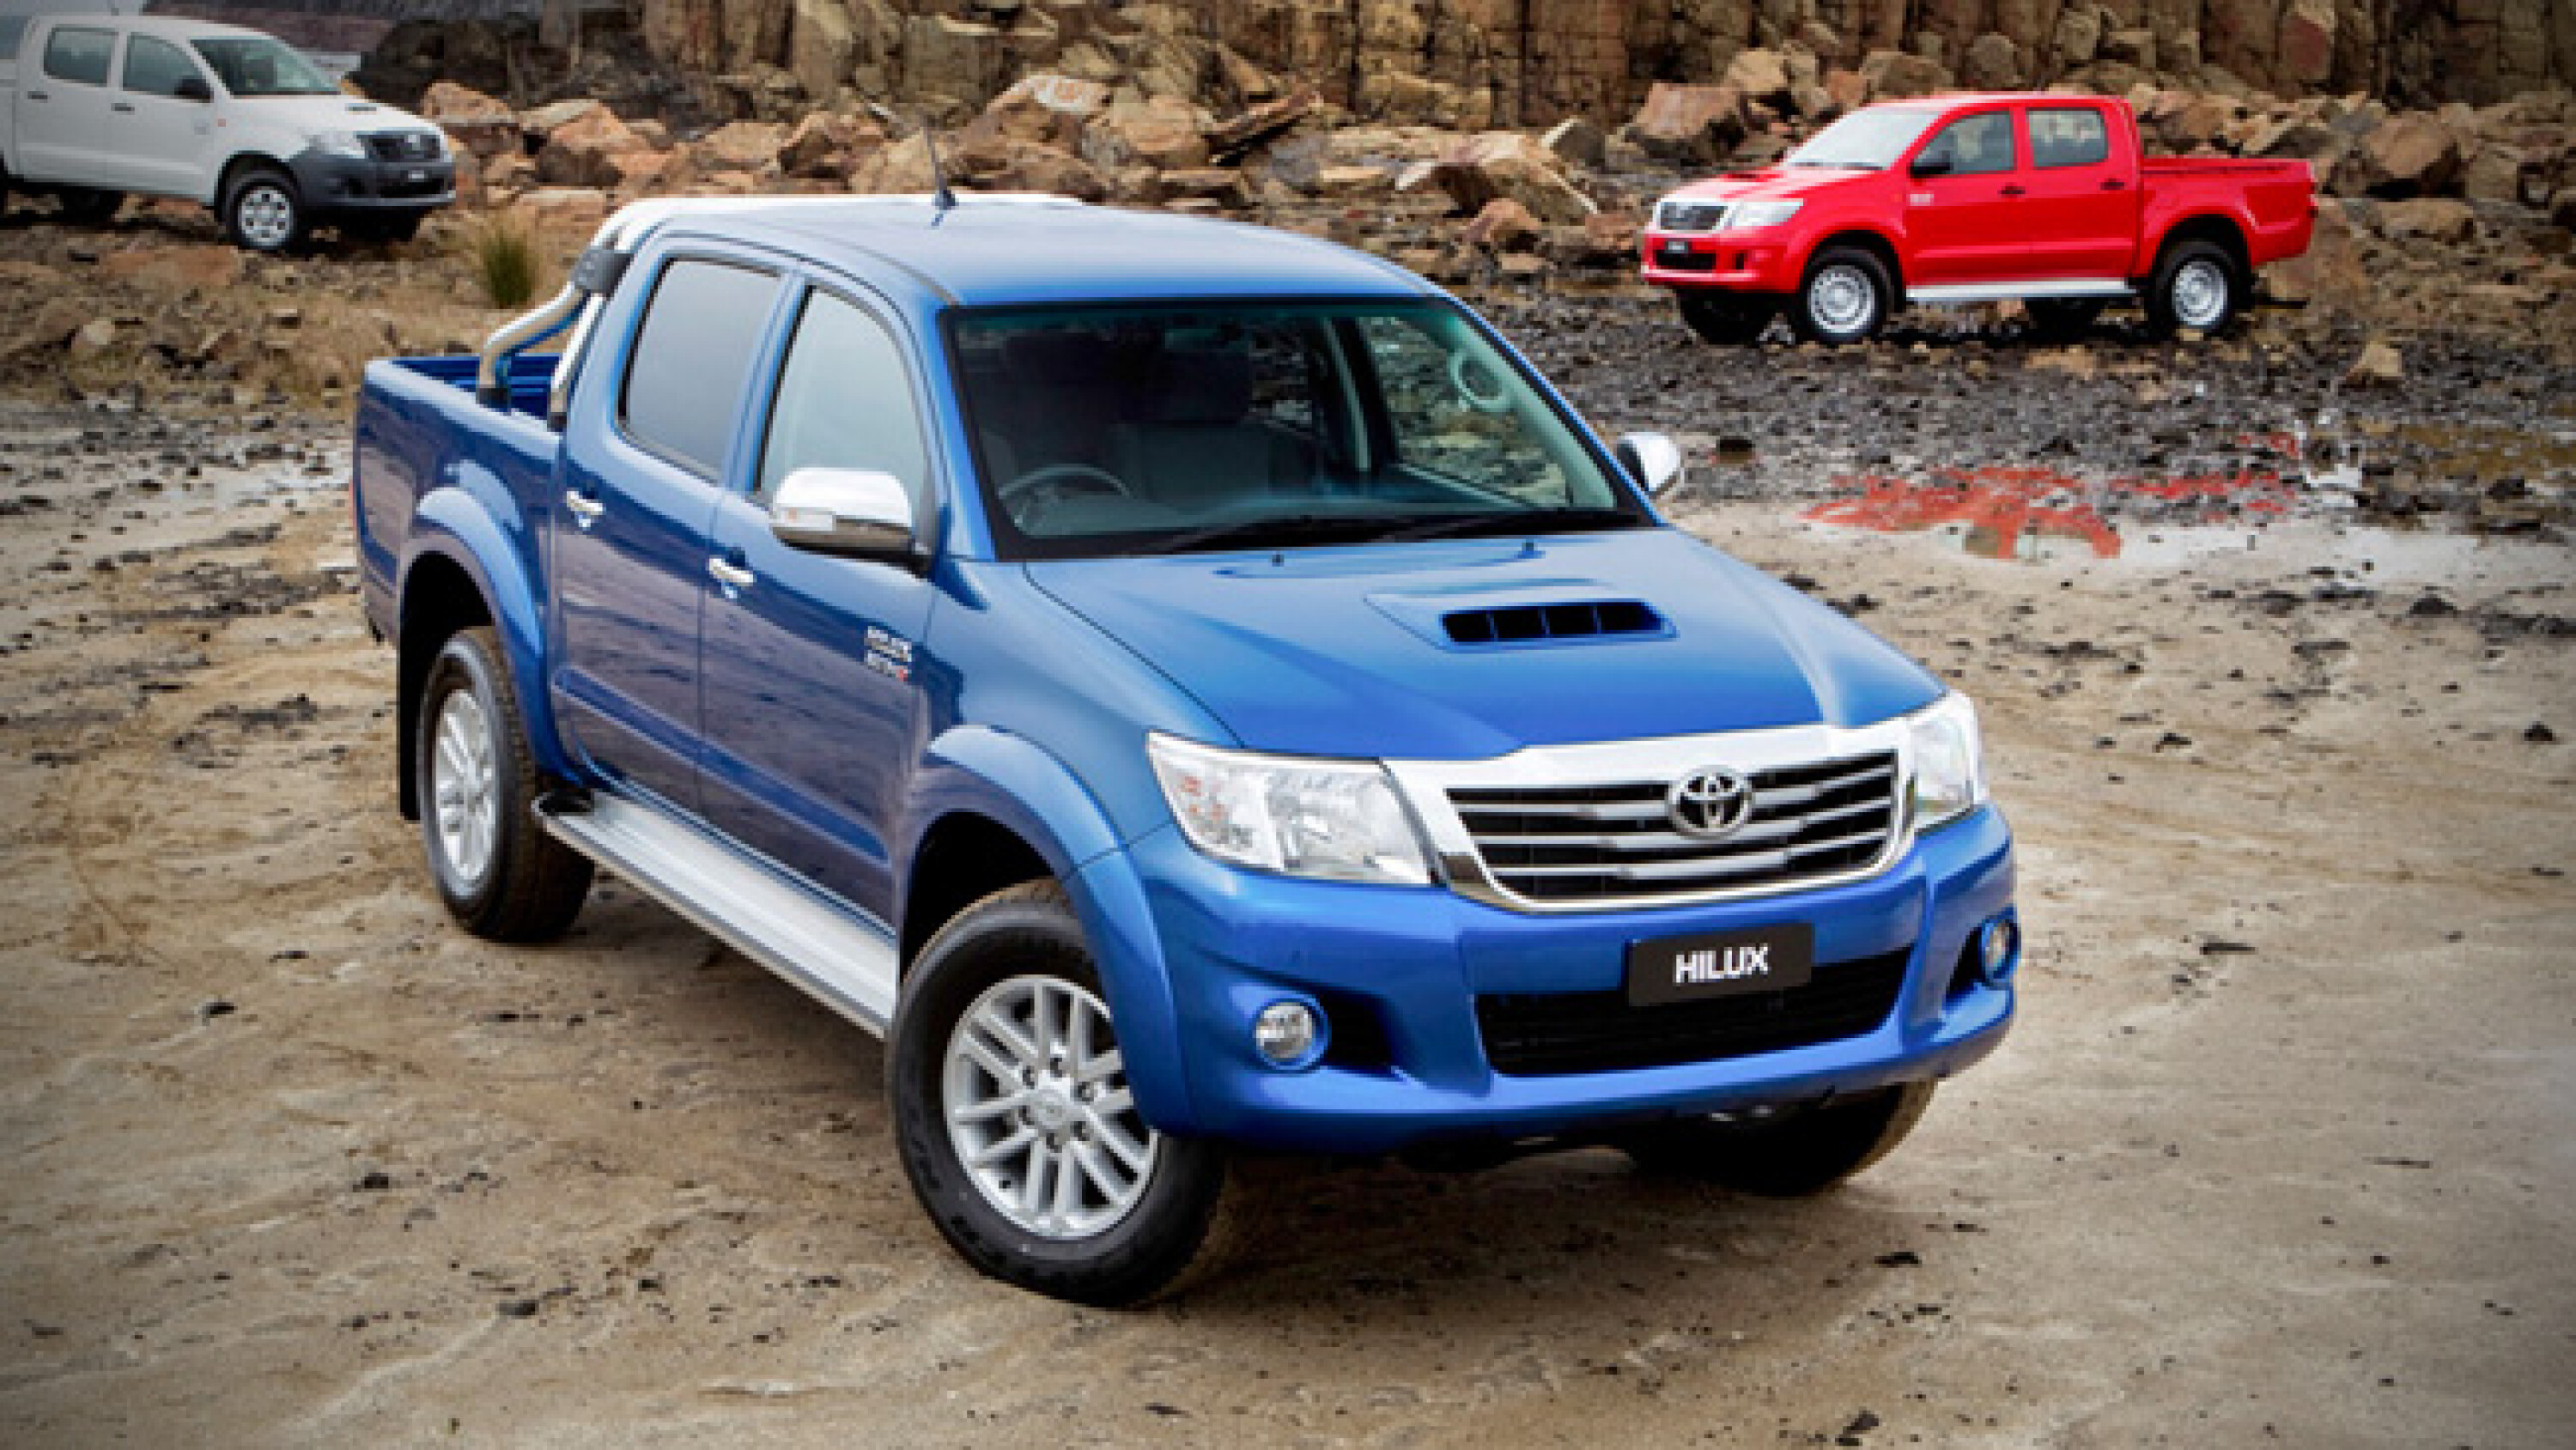
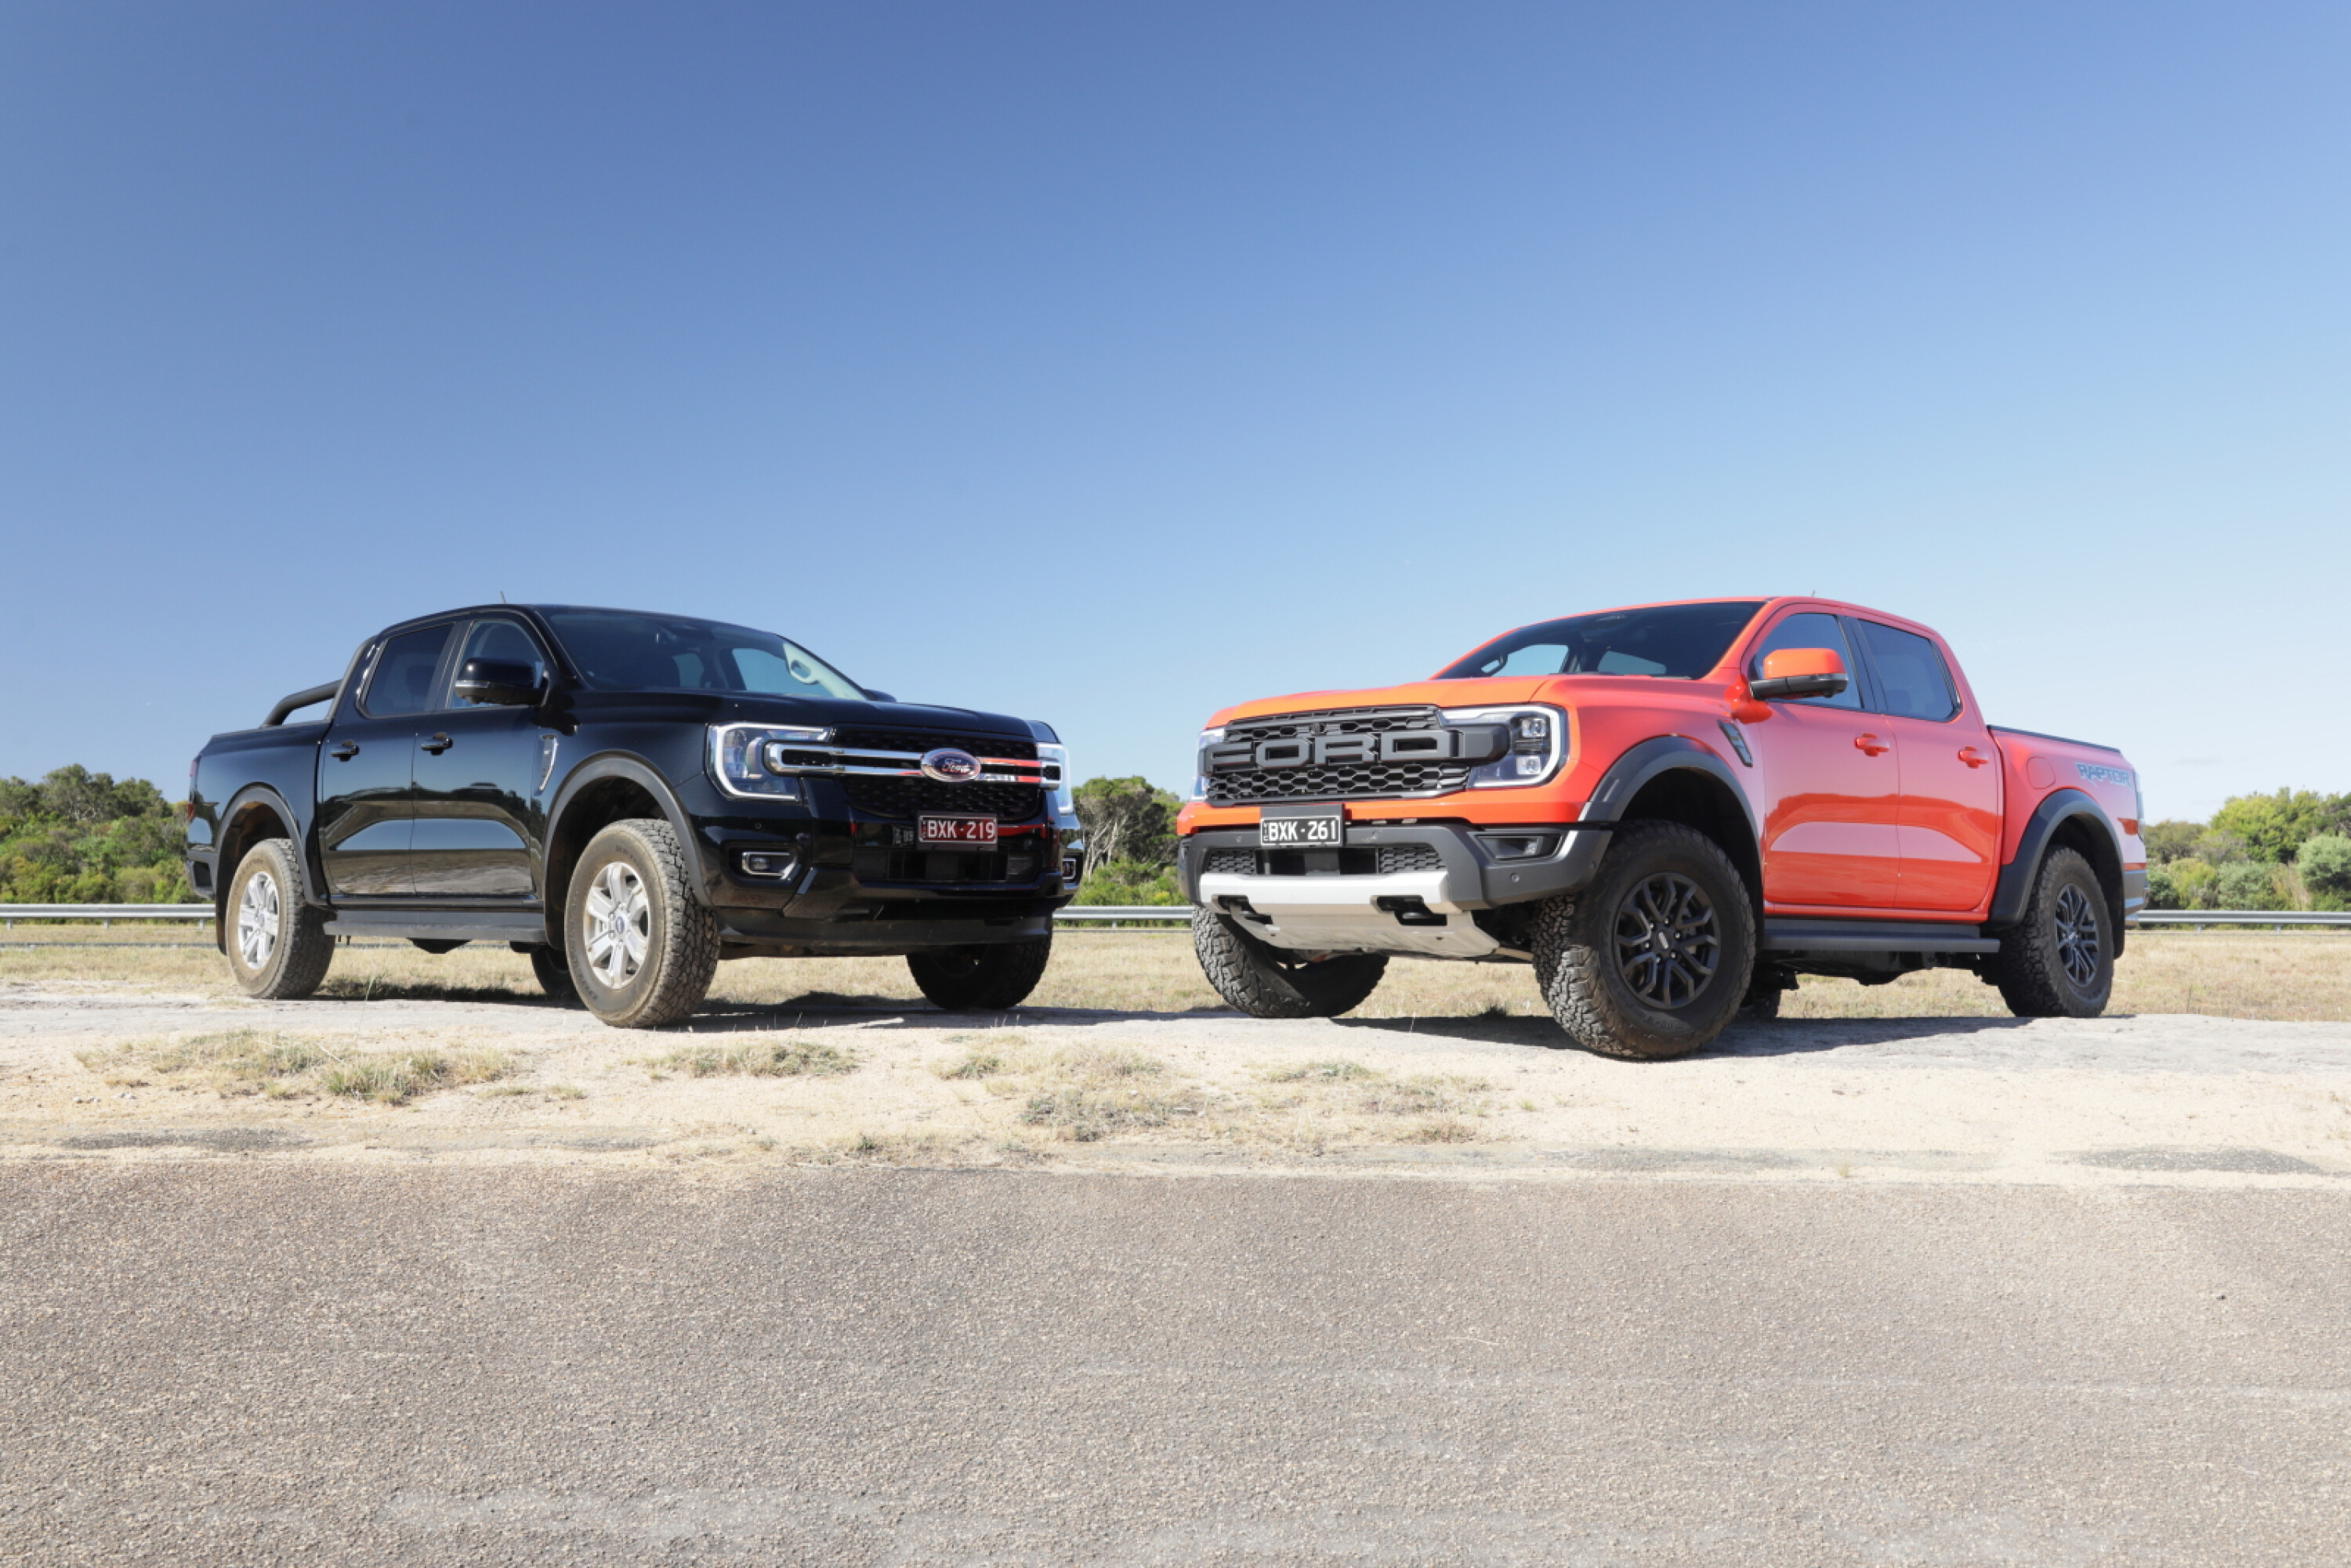
In November, the Ford Ranger was the most popular second-hand vehicle, with 4683 examples purchased – up 1.4% on October.
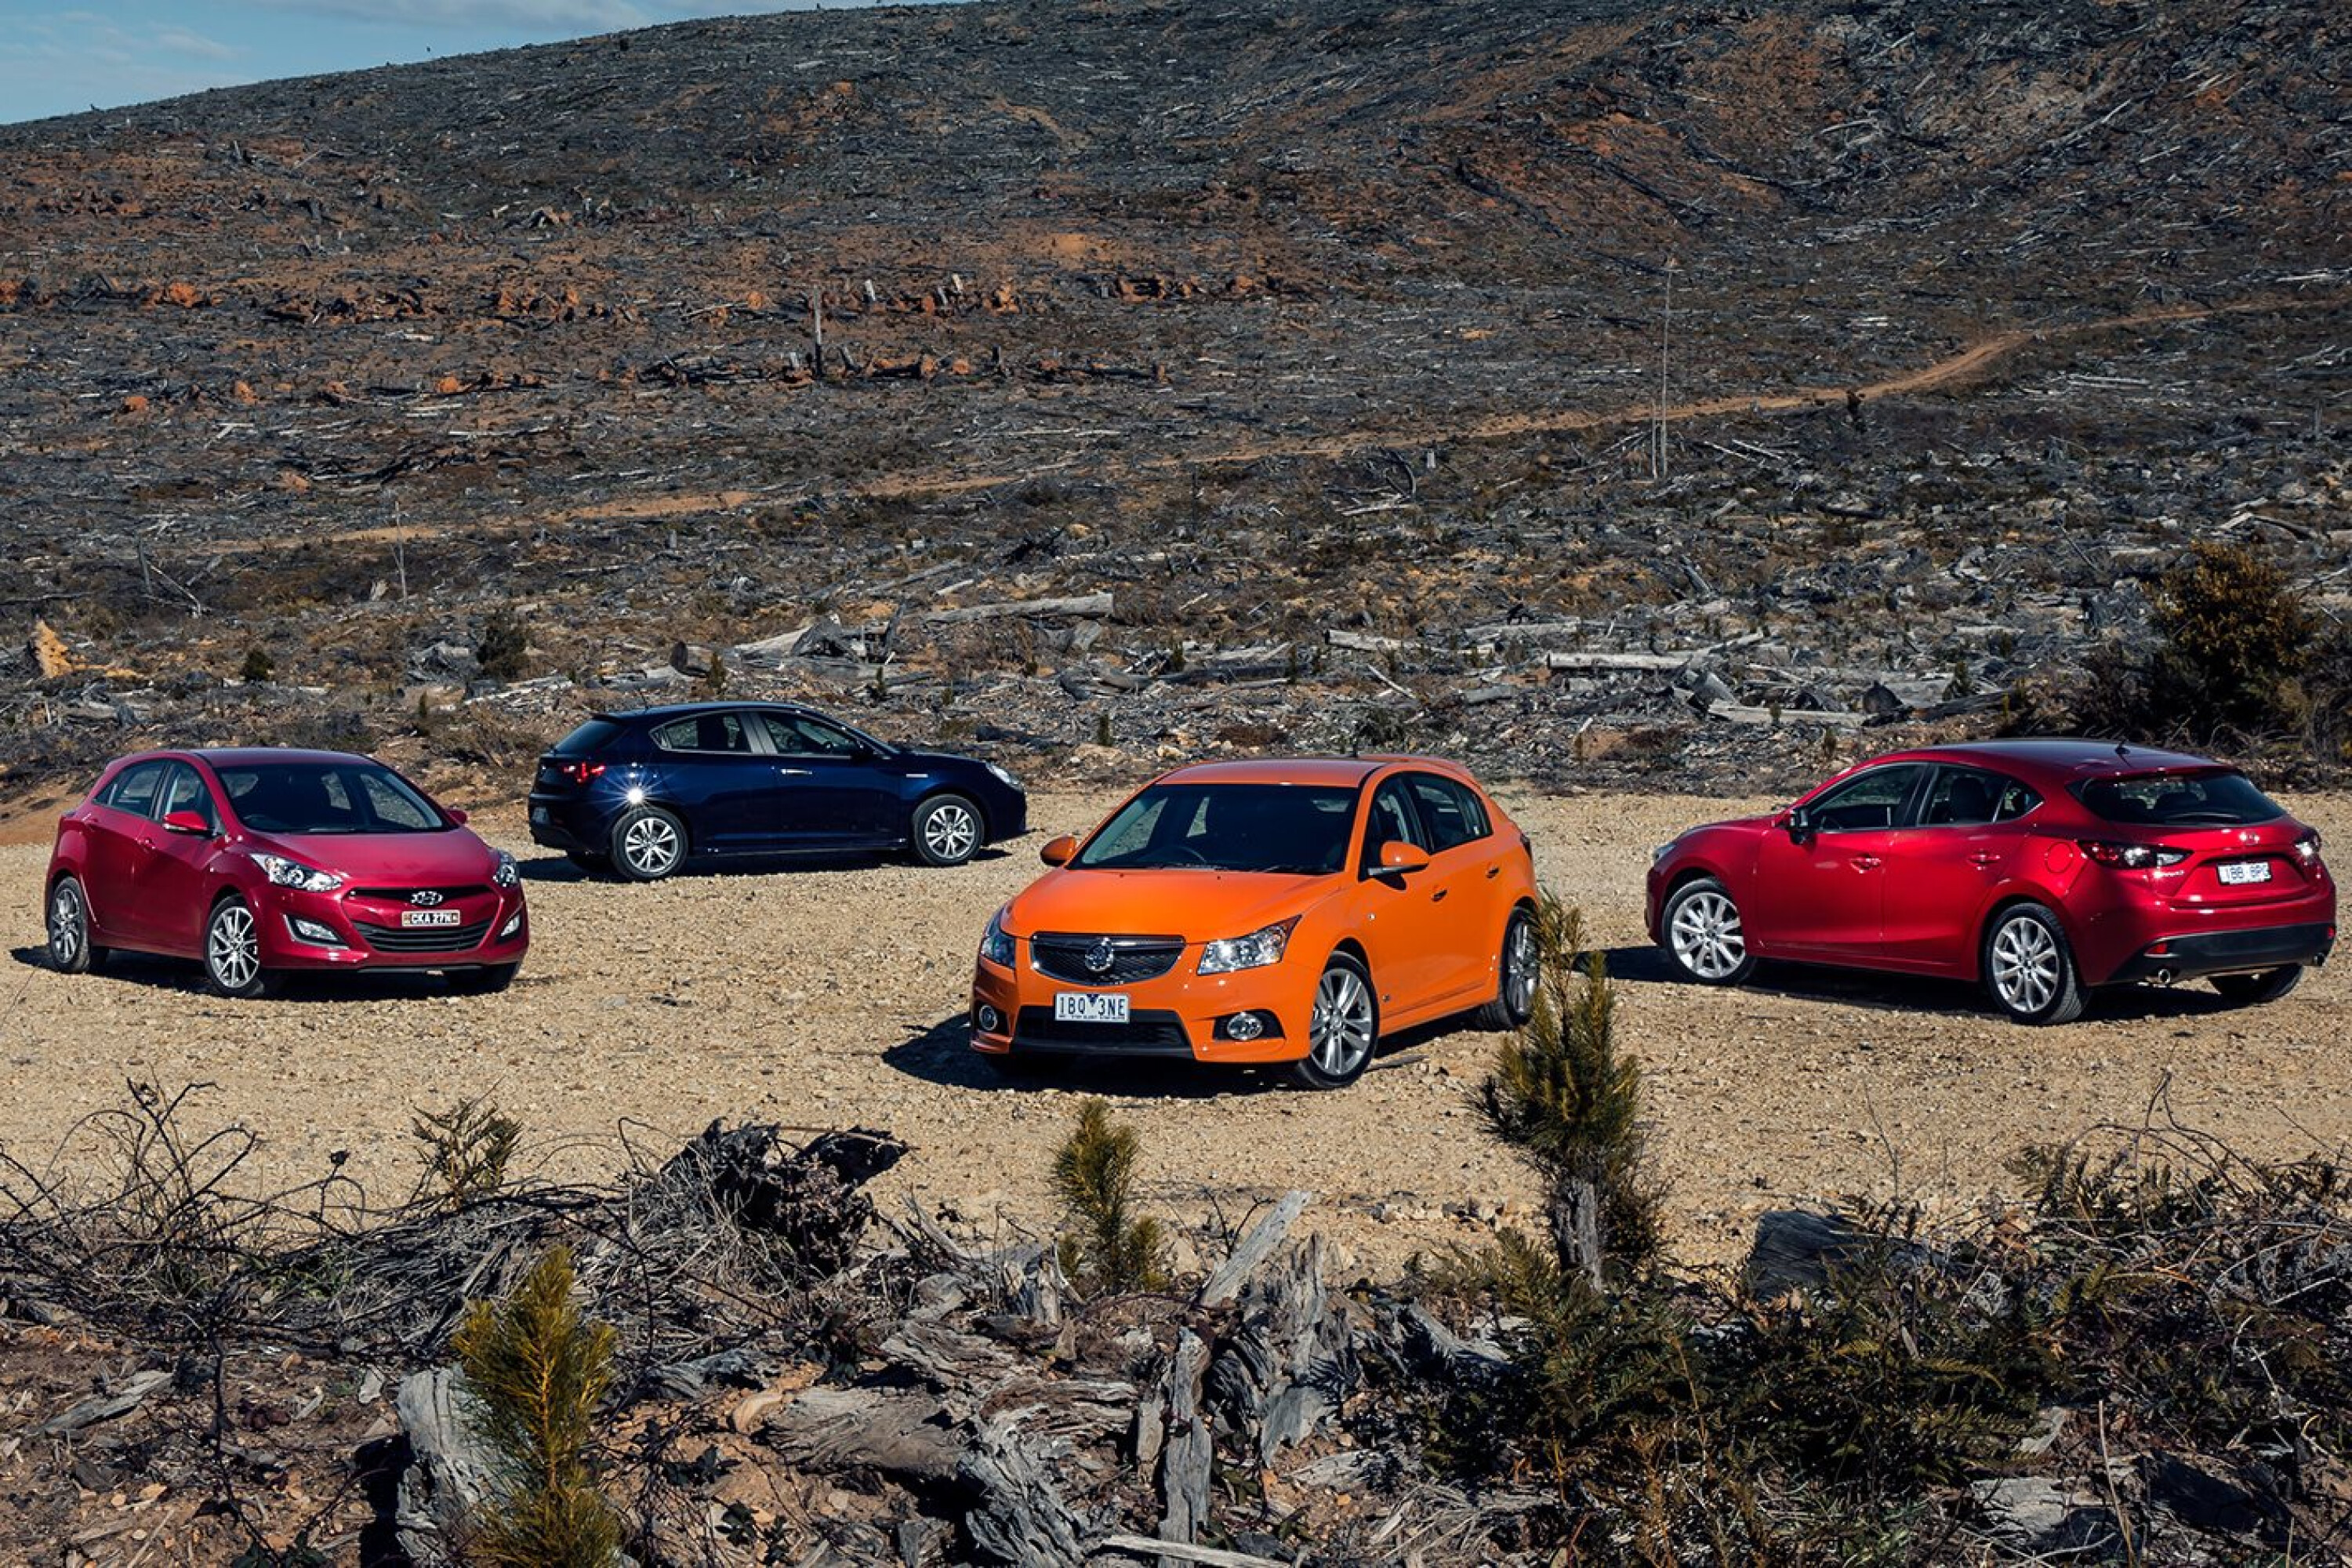
Then came the Toyota HiLux (4066), Toyota Corolla (3371), Hyundai i30 (2624), Mazda 3 (2354), and Mitsubishi Triton.
Following the Triton is another sales stalwart, the Toyota Camry (2324), then the Toyota RAV4 (2159), Mazda CX-5 (2023), and the Toyota Prado (1849). Data provided for the best-selling cars covers models up to 10 years old (to 2013).
| Make and model | Nov-23 Sales | Oct-23 Sales | Variance (%) | Days to sell (average) |
|---|---|---|---|---|
| Ford Ranger | 4683 | 4619 | 1.40% | 52.6 |
| Toyota HiLux | 4066 | 4004 | 1.50% | 52.3 |
| Toyota Corolla | 3371 | 3456 | -2.50% | 39.7 |
| Hyundai i30 | 2624 | 2711 | -3.20% | 38.4 |
| Mazda 3 | 2354 | 2465 | -4.50% | 35.9 |
| Mitsubishi Triton | 2324 | 2357 | -1.40% | 42.6 |
| Toyota Camry | 2324 | 2463 | -5.60% | 49.4 |
| Toyota RAV4 | 2159 | 2203 | -2% | 45.2 |
| Mazda CX-5 | 2023 | 1922 | 5.30% | 43.2 |
| Toyota Prado | 1849 | 1860 | -0.60% | 53.7 |
4
Another interesting statistic provided is the average vehicle sale time, which has grown from a minimum of 40.5 days in March 2023 to 52 days in November.
Of the best-sellers list, it was small cars such as the Mazda 3, Toyota Corolla, and Hyundai i30 with the quickest average sales times.
Subscribe to any of our motoring magazines today!
Get your monthly fix of news, reviews and stories on the greatest cars and minds in the automotive world.
We recommend
-
 News
NewsVFACTS November 2023: Yearly new car sales record likely, Ranger beats HiLux
The Australian new-car market has posted record sales for the fifth month running with a yearly high forecasted, as the Ford Ranger looks to overtake the Toyota HiLux as the nation's top-selling car in a neck-and-neck final race
-
 News
NewsThe safest used cars you can buy in 2023
Here are the safest used cars as ranked by a Monash University study
-
 Features
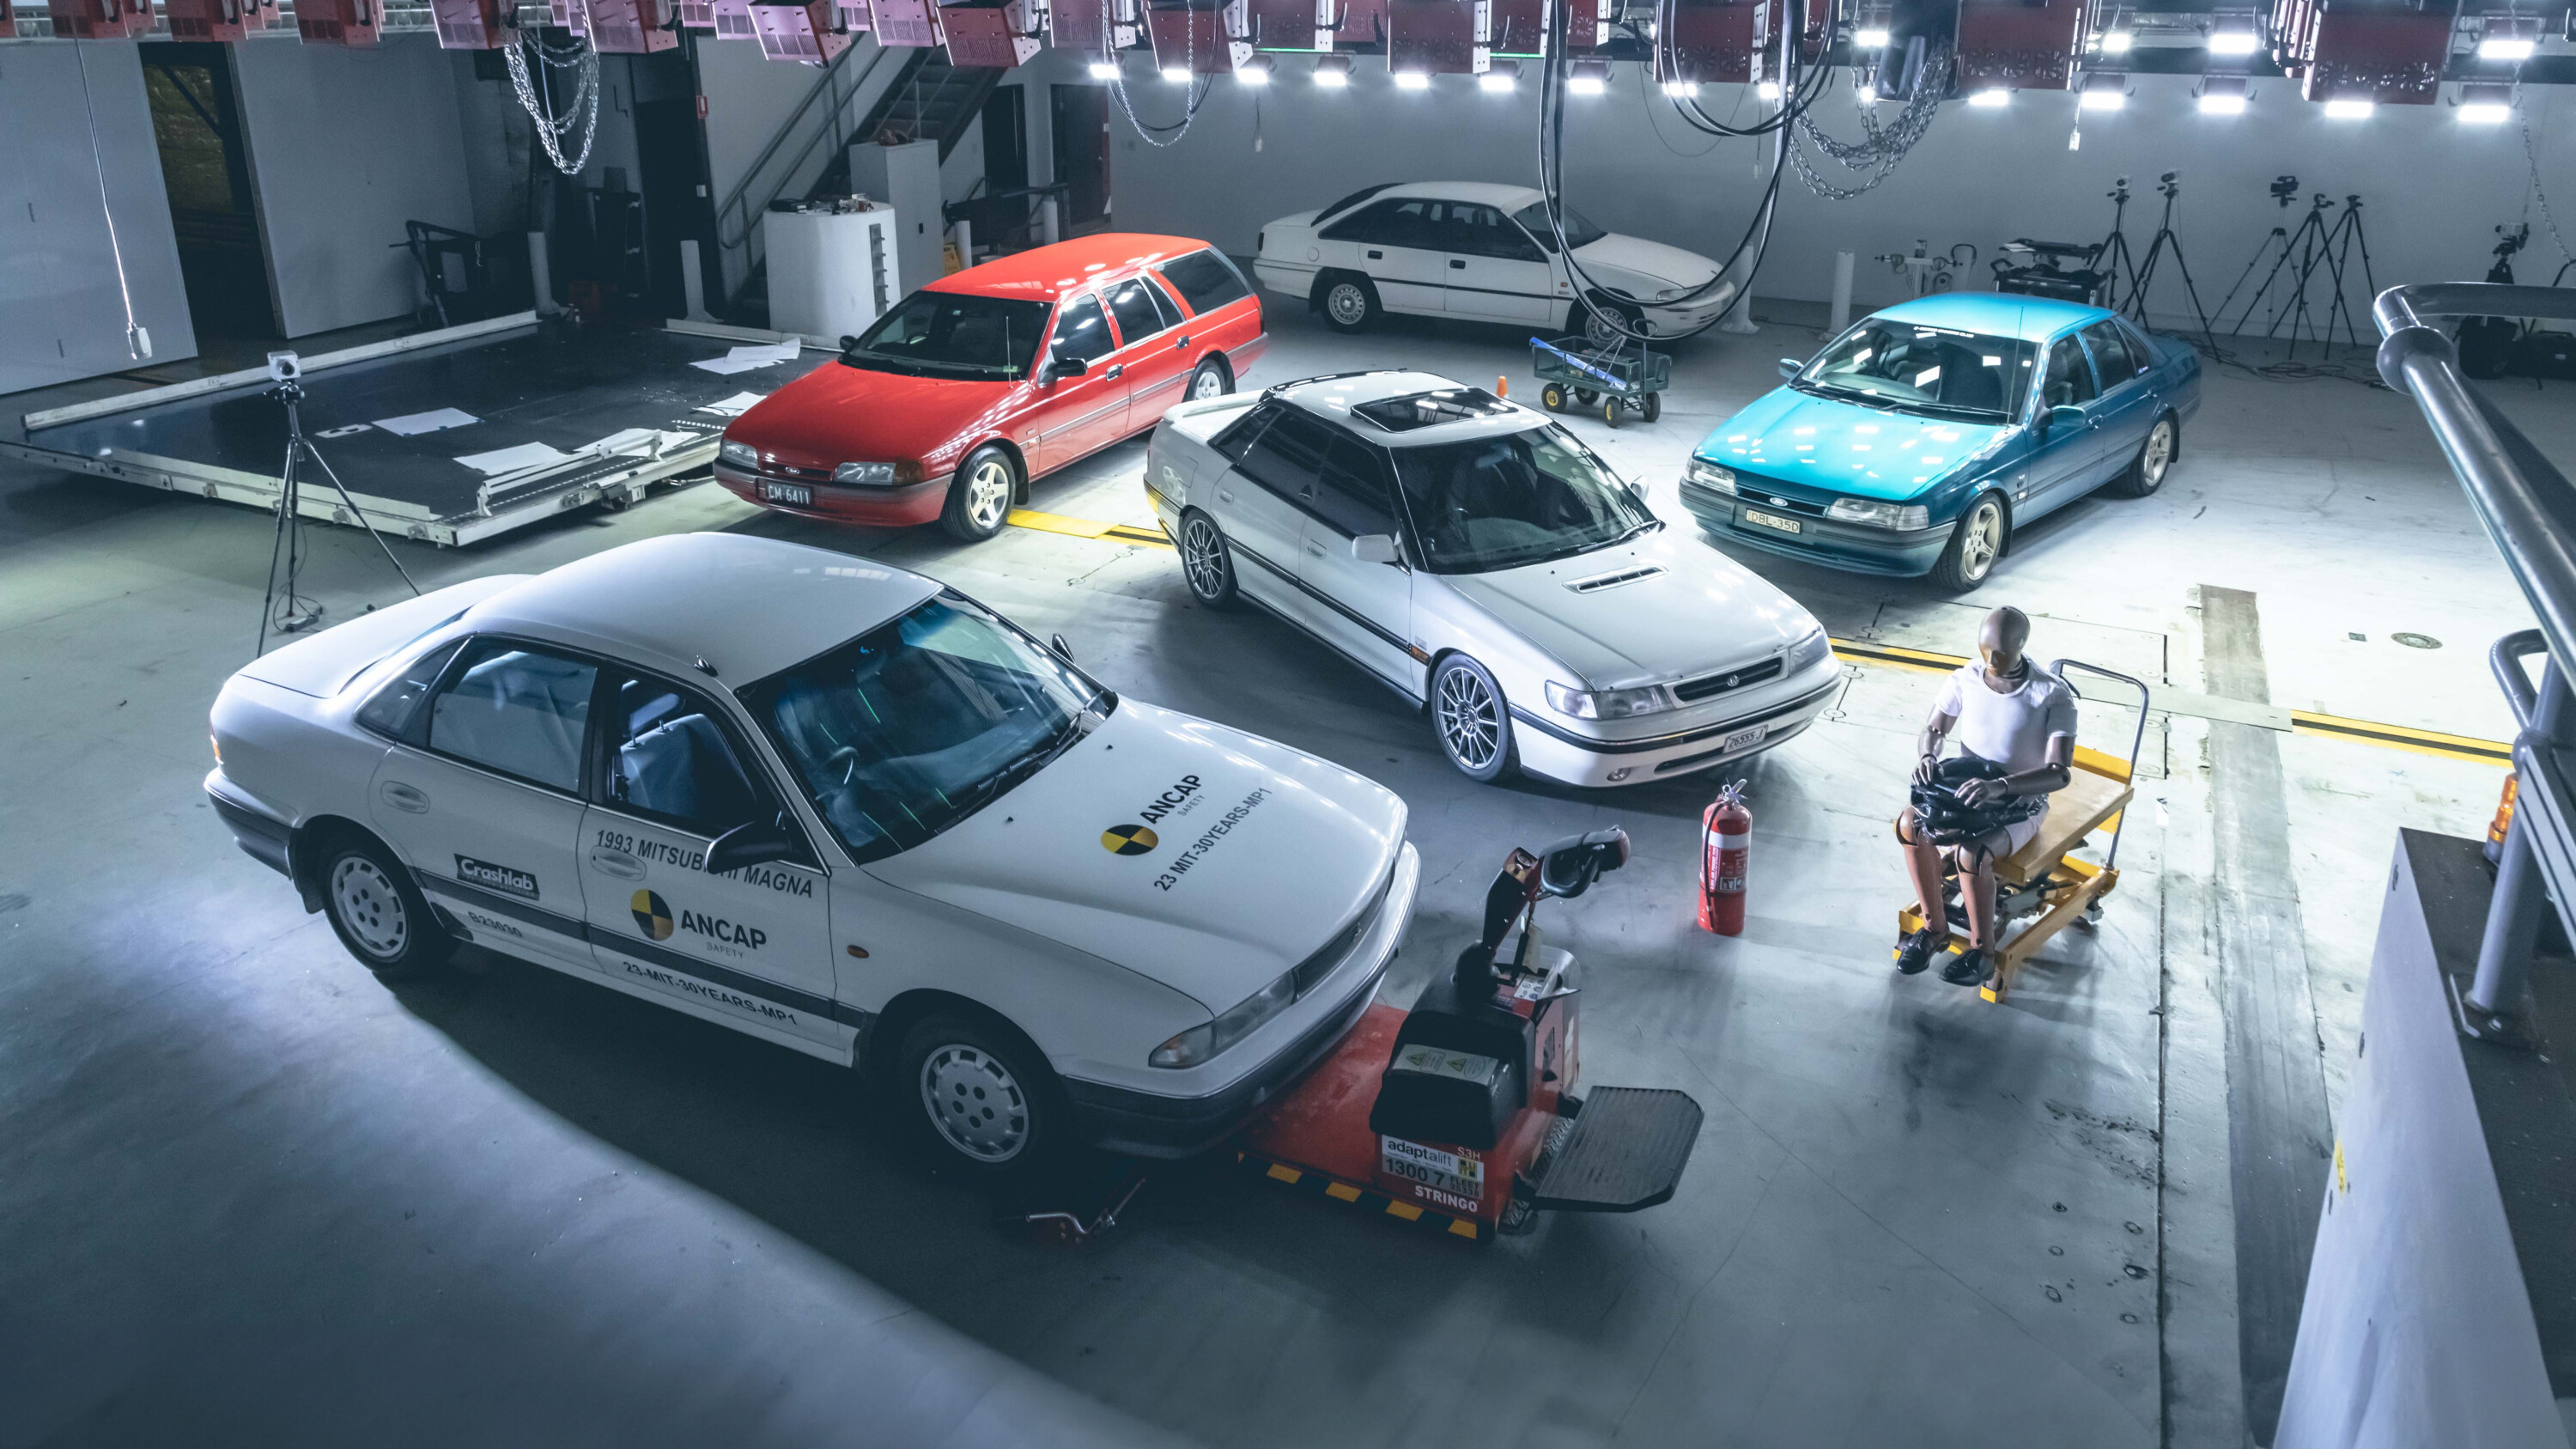
Wheels x ANCAP: How will this 30yr-old car fare in a modern crash test?
We find out with the help of ANCAP and a Mitsubishi Magna…