Delivery delays eased for the best July in Australian new-car sales history.
Official results published by the Federal Chamber of Automobile Industries (FCAI) reveal 96,859 vehicles were registered in July this year. That may be down on June (124,926) but is up 14.7% on the same month last year – and it’s the biggest July ever.
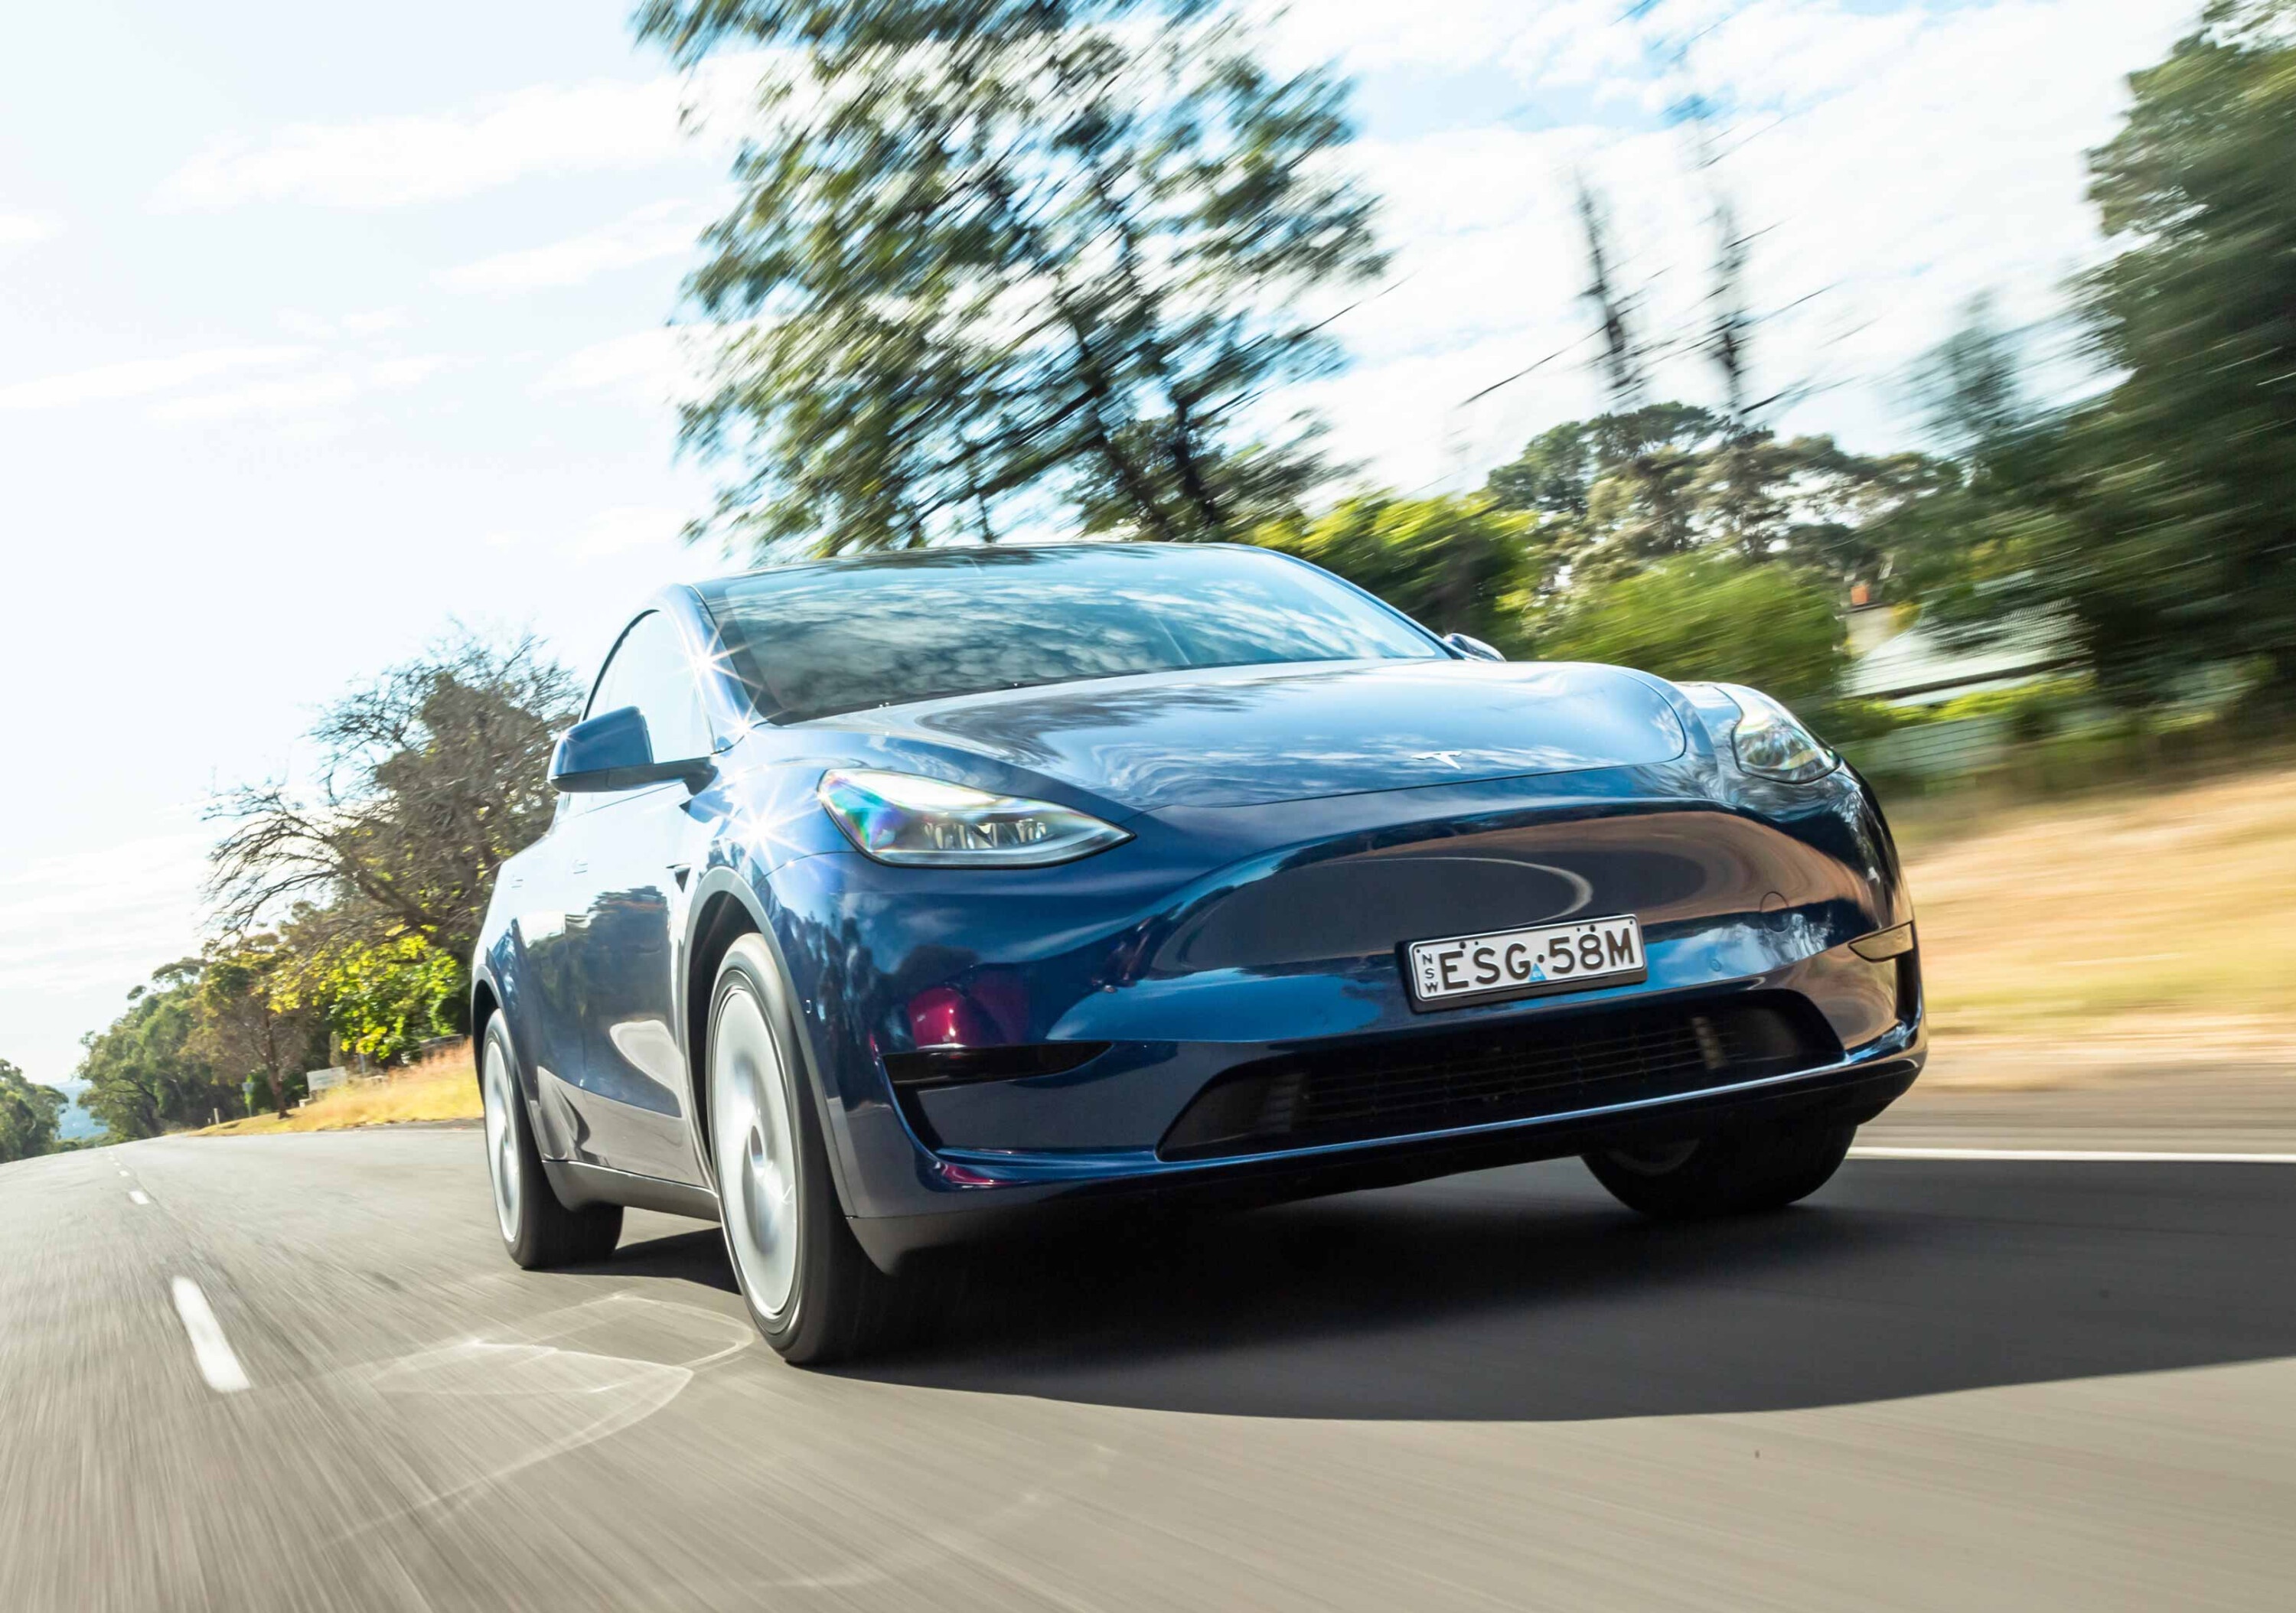
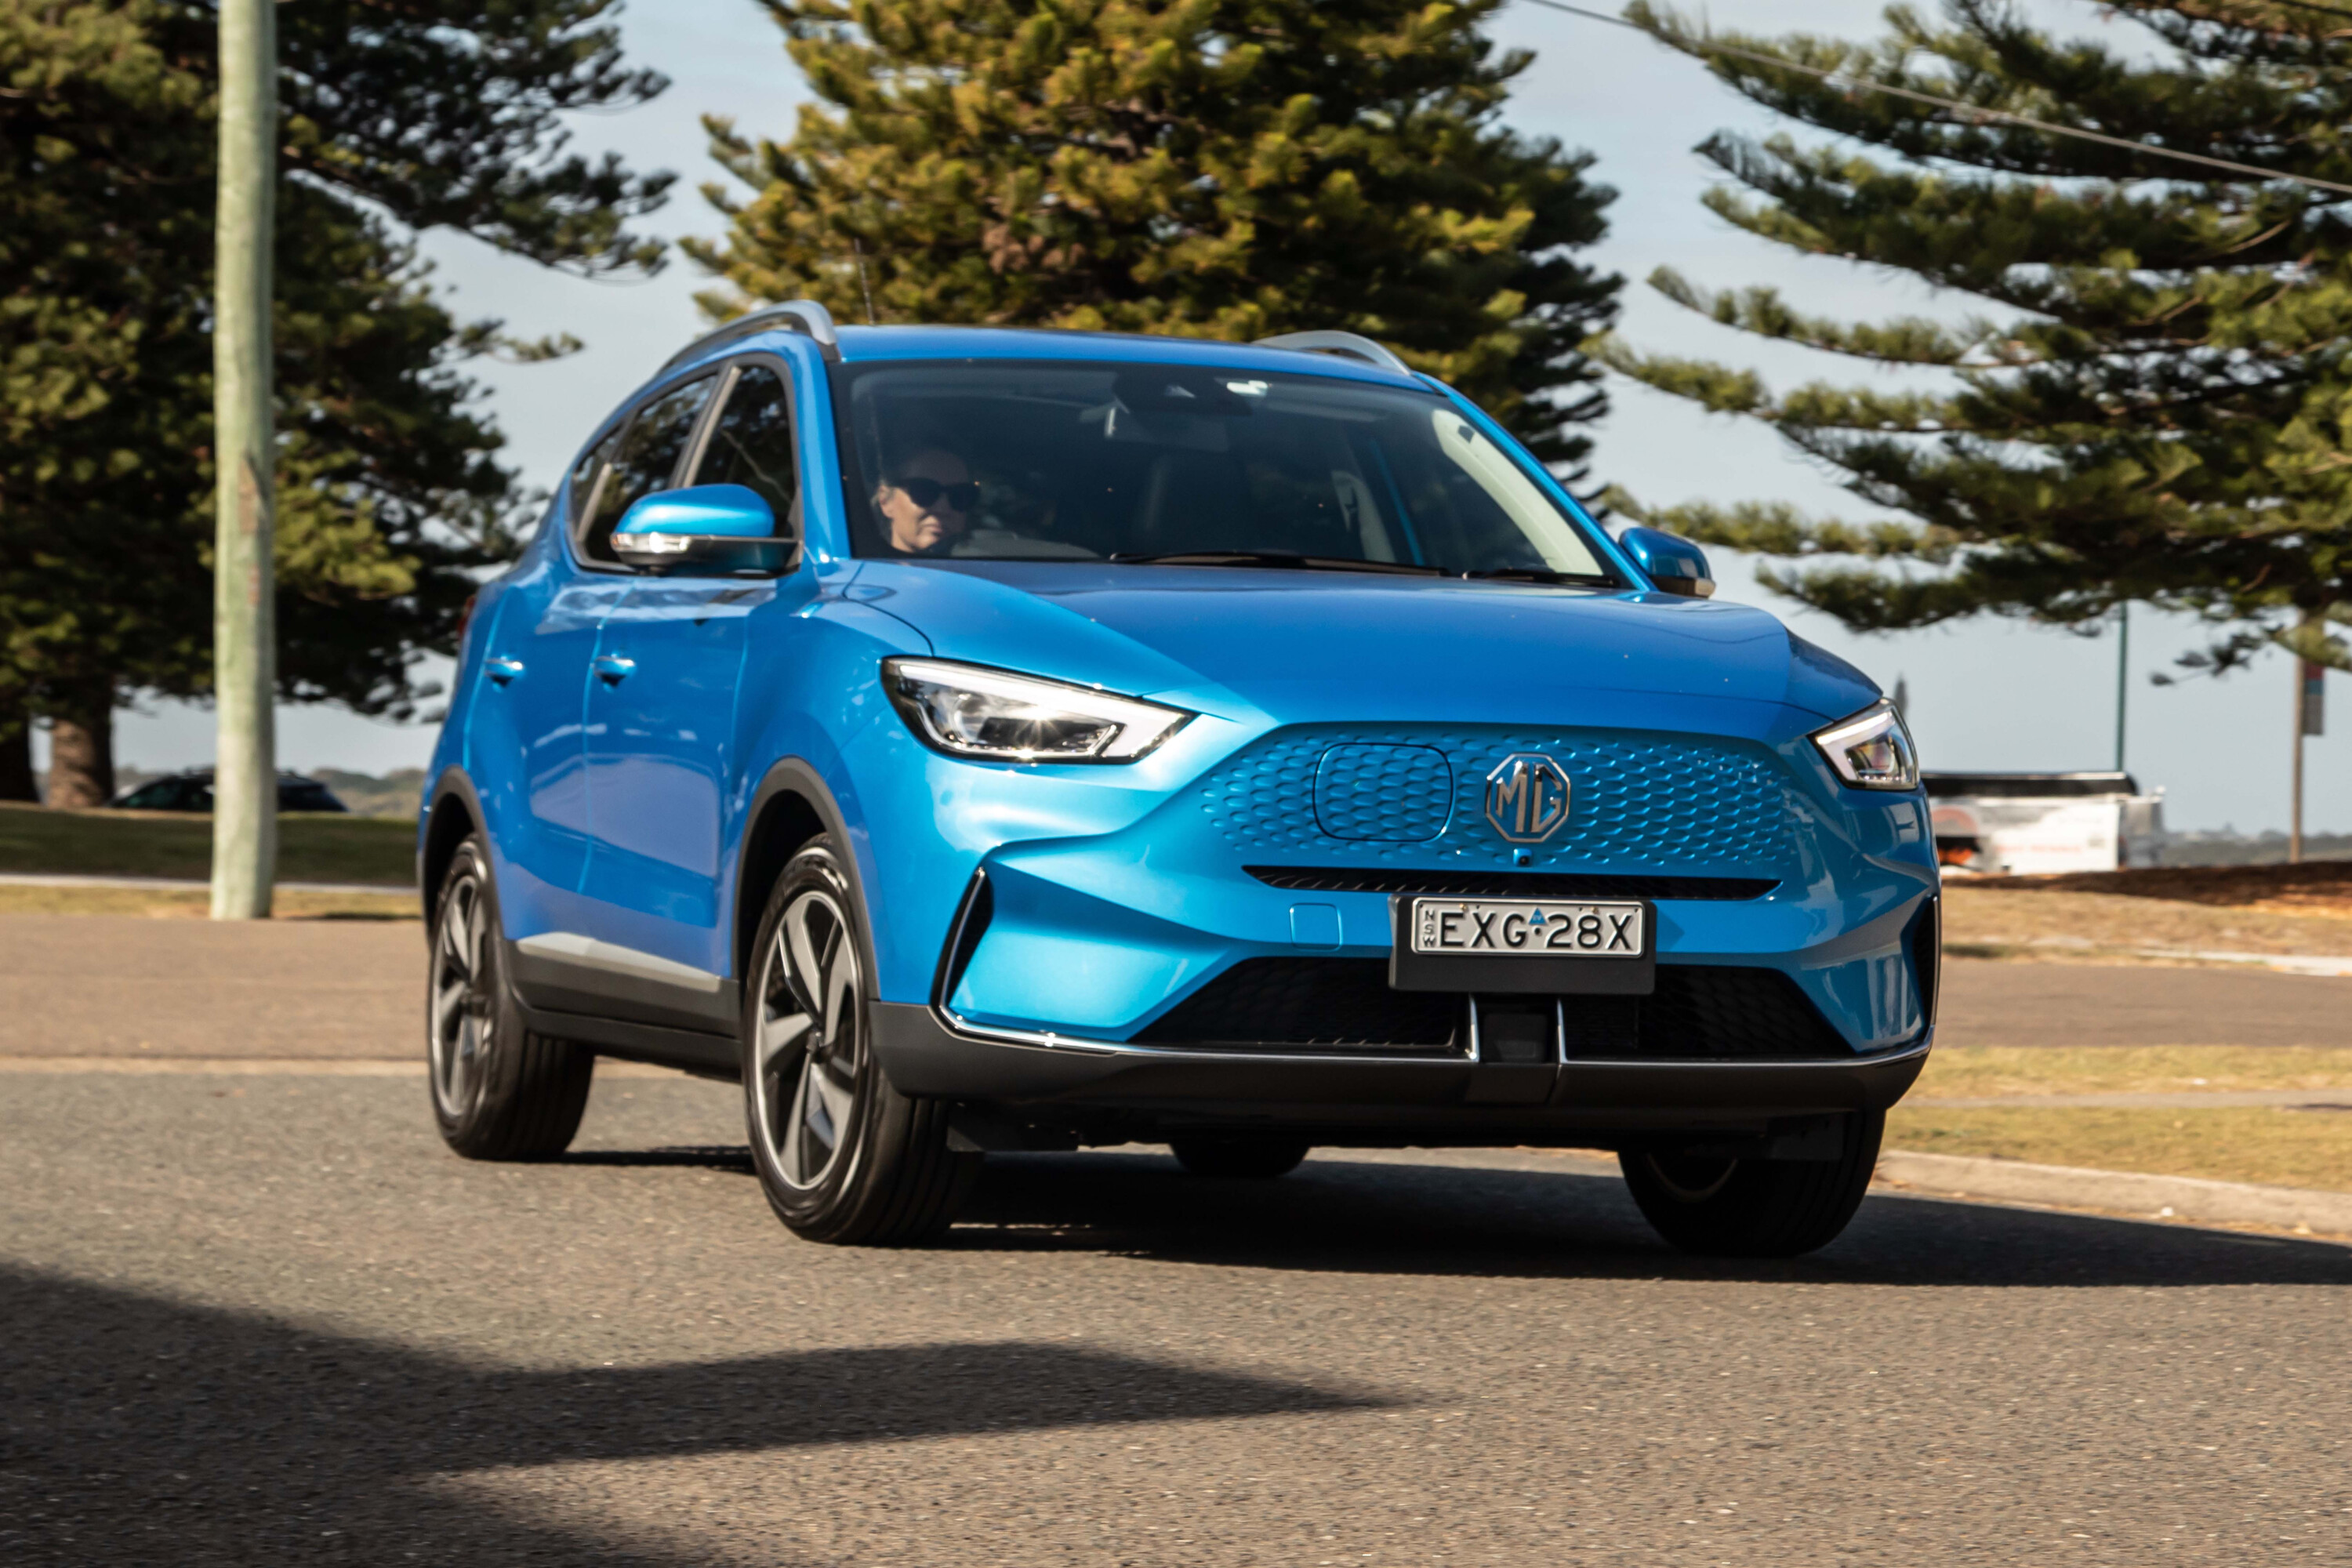
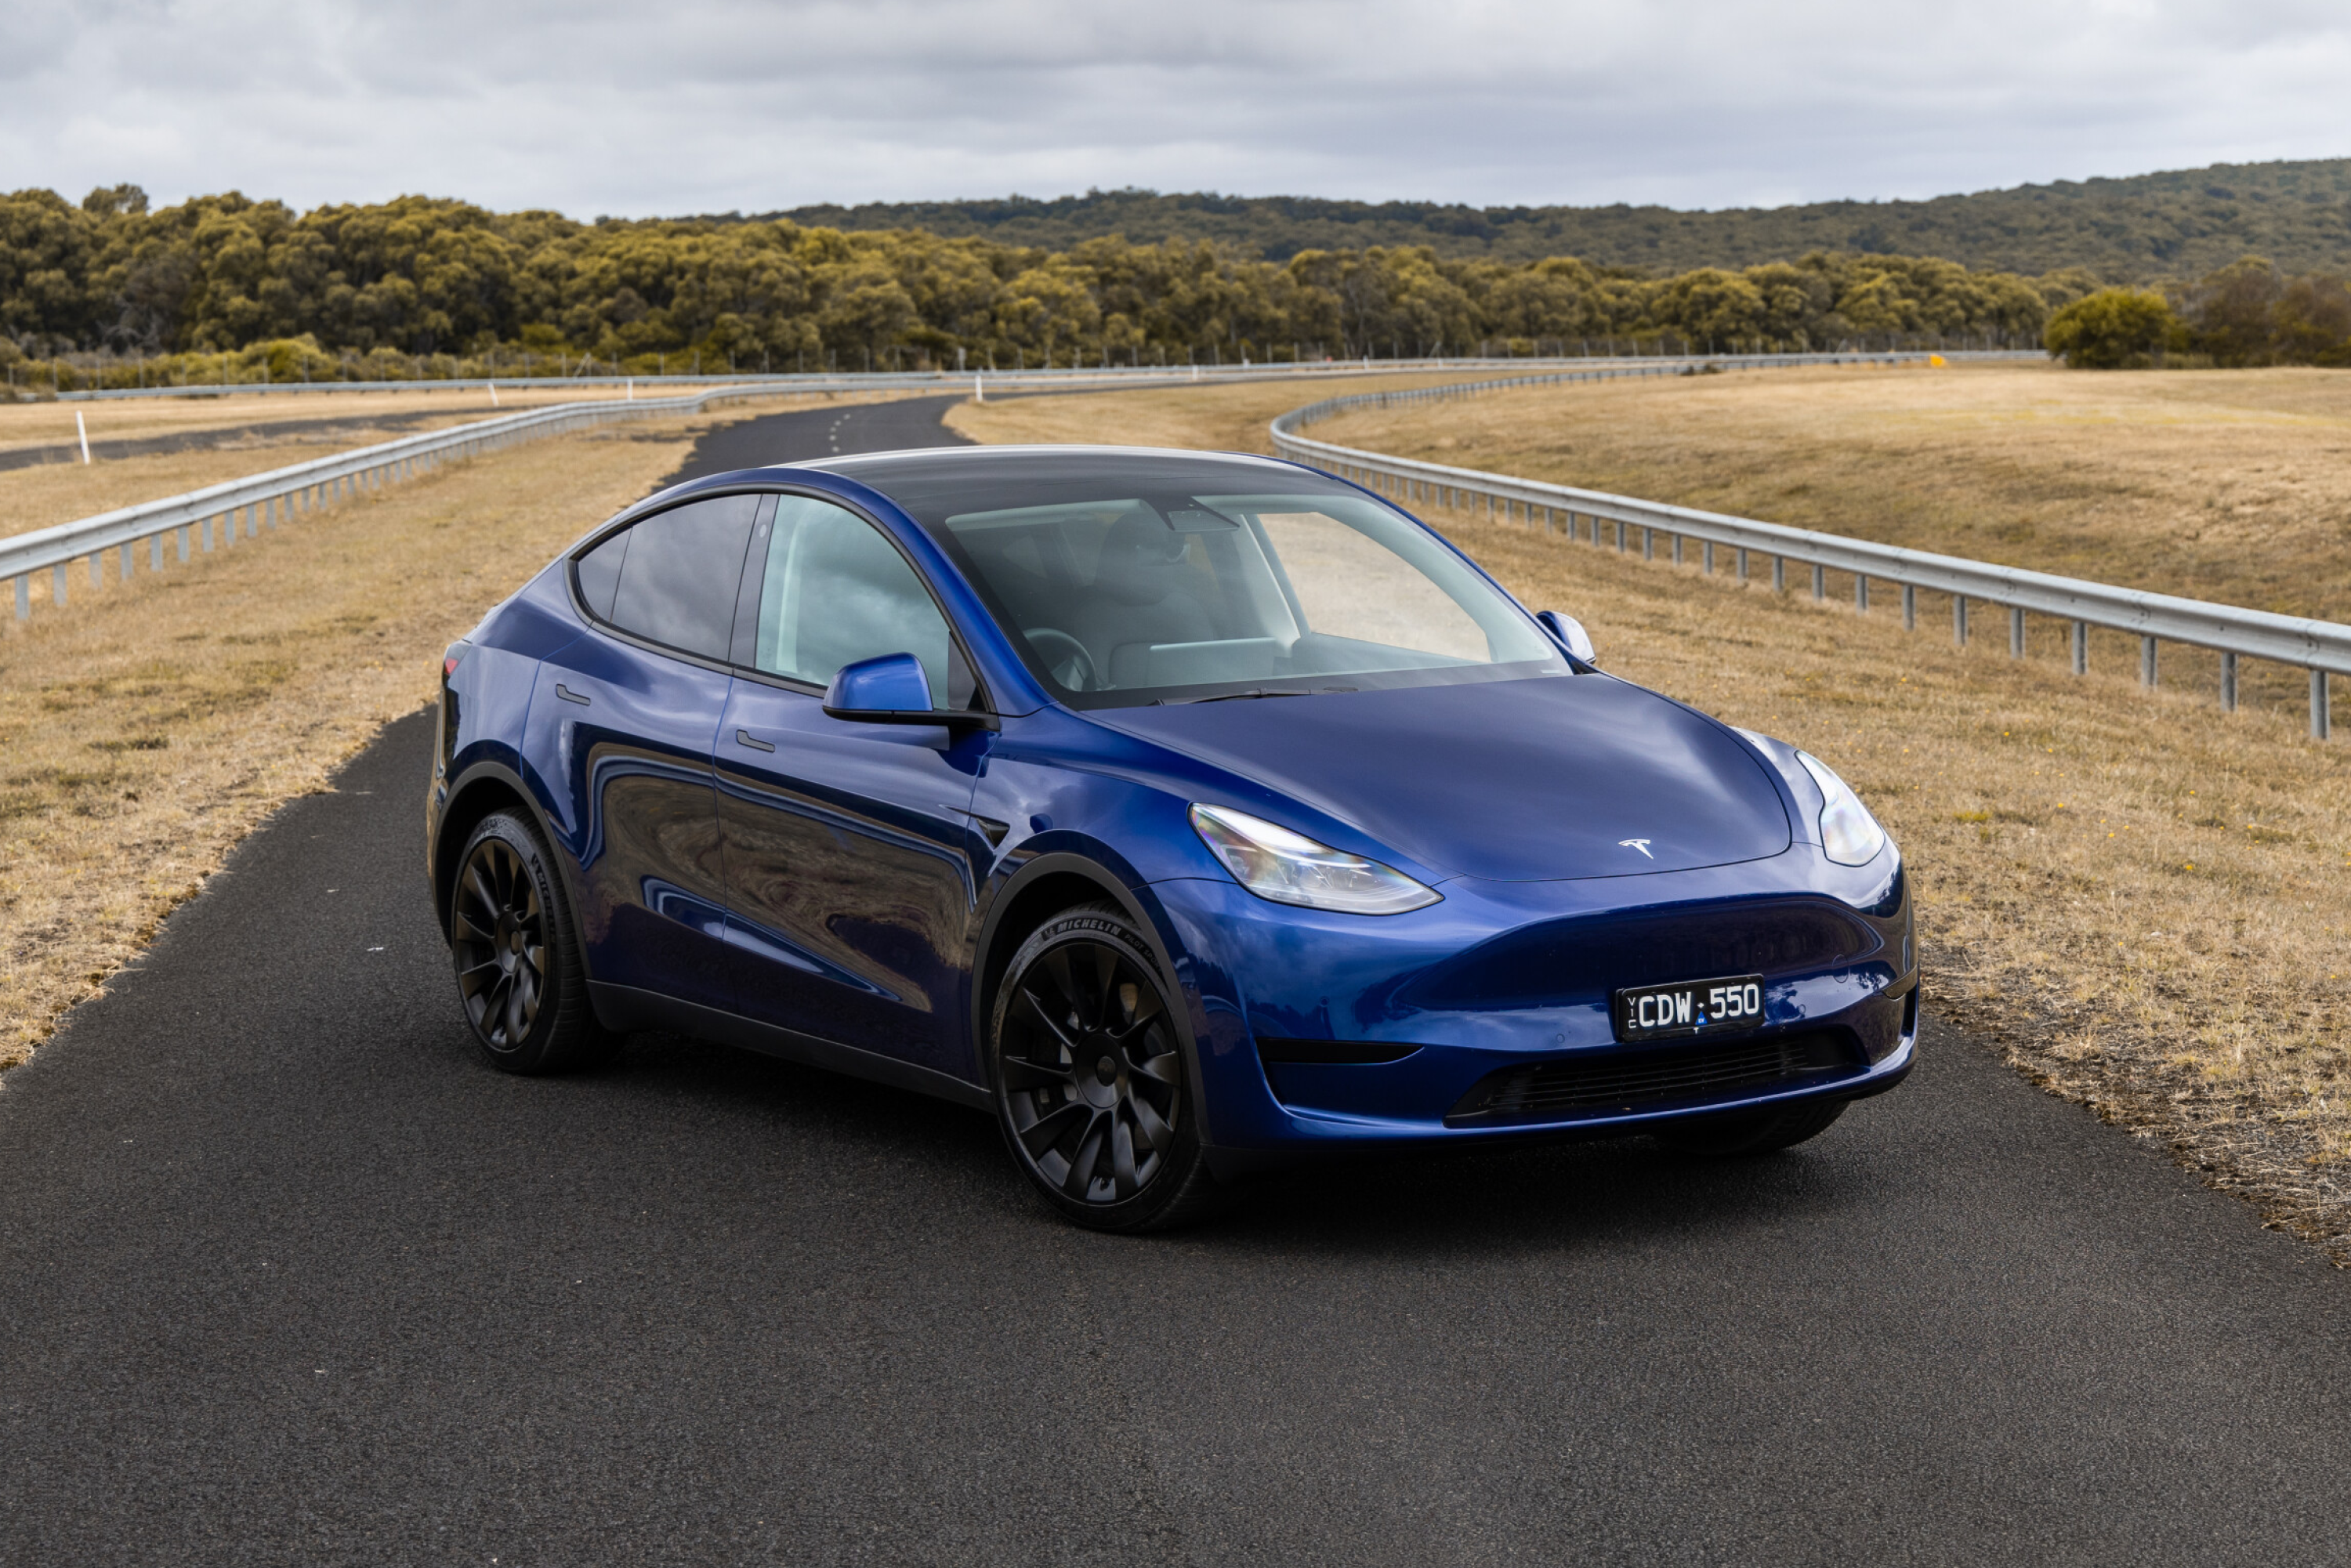
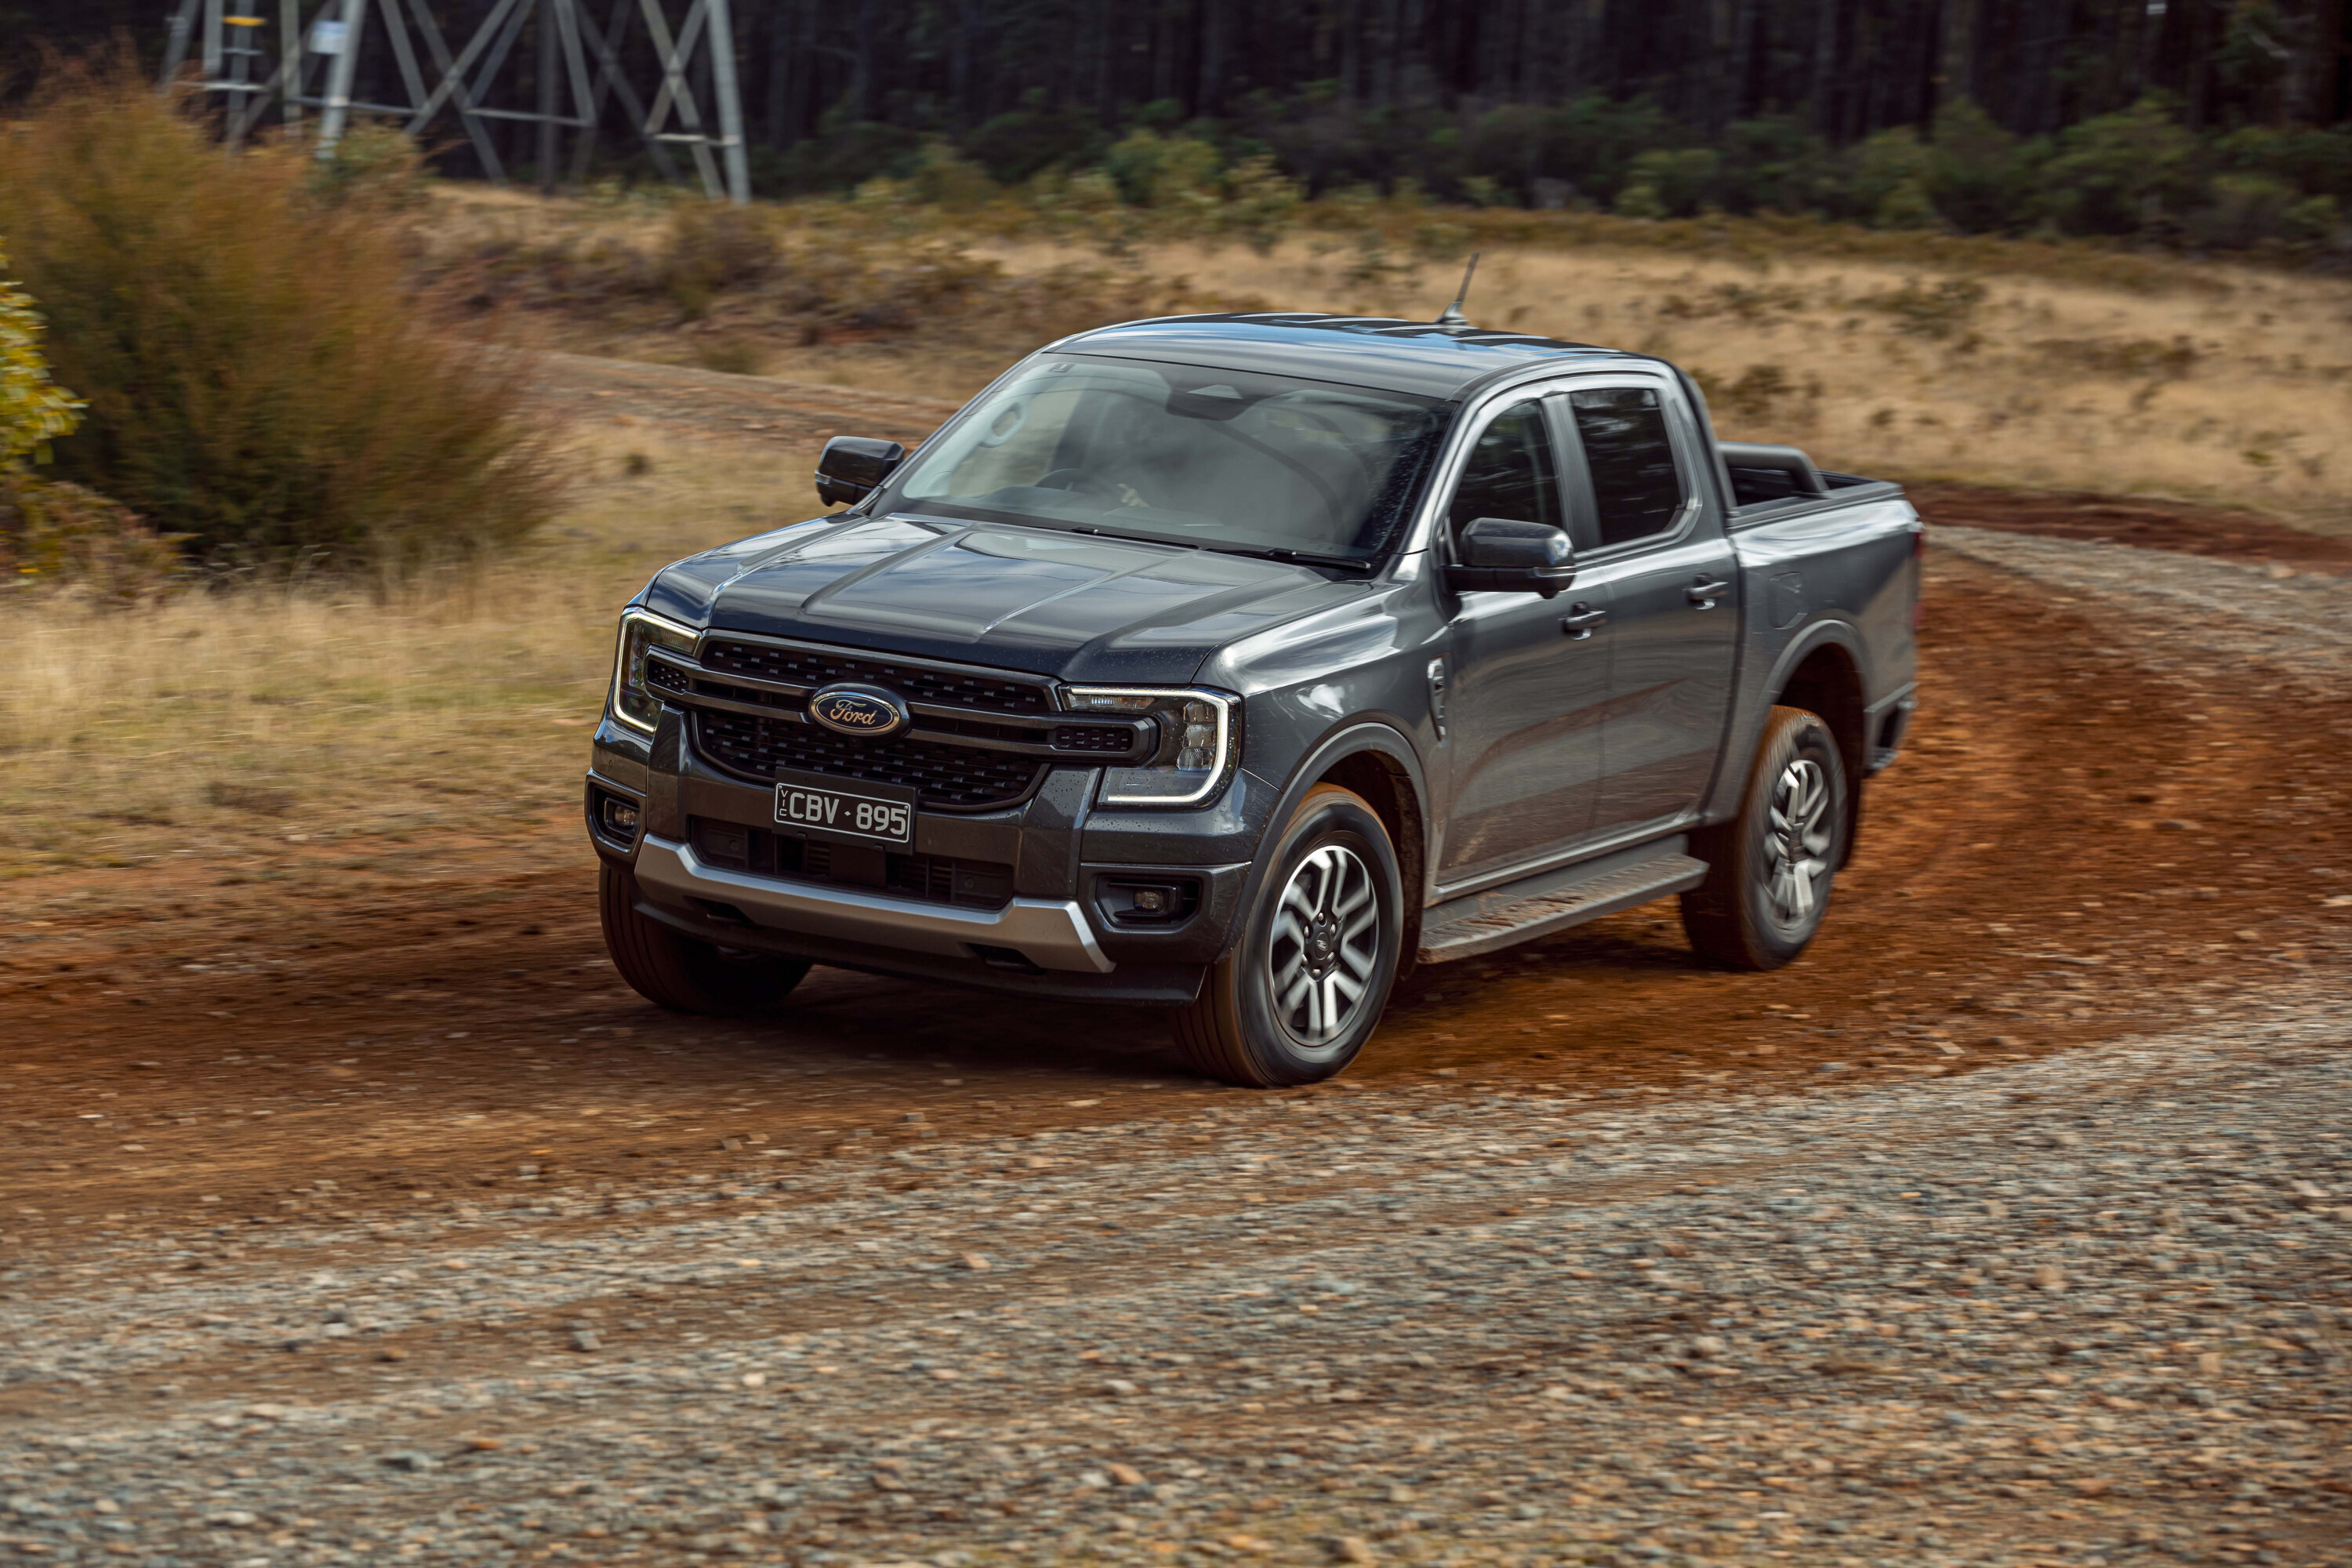
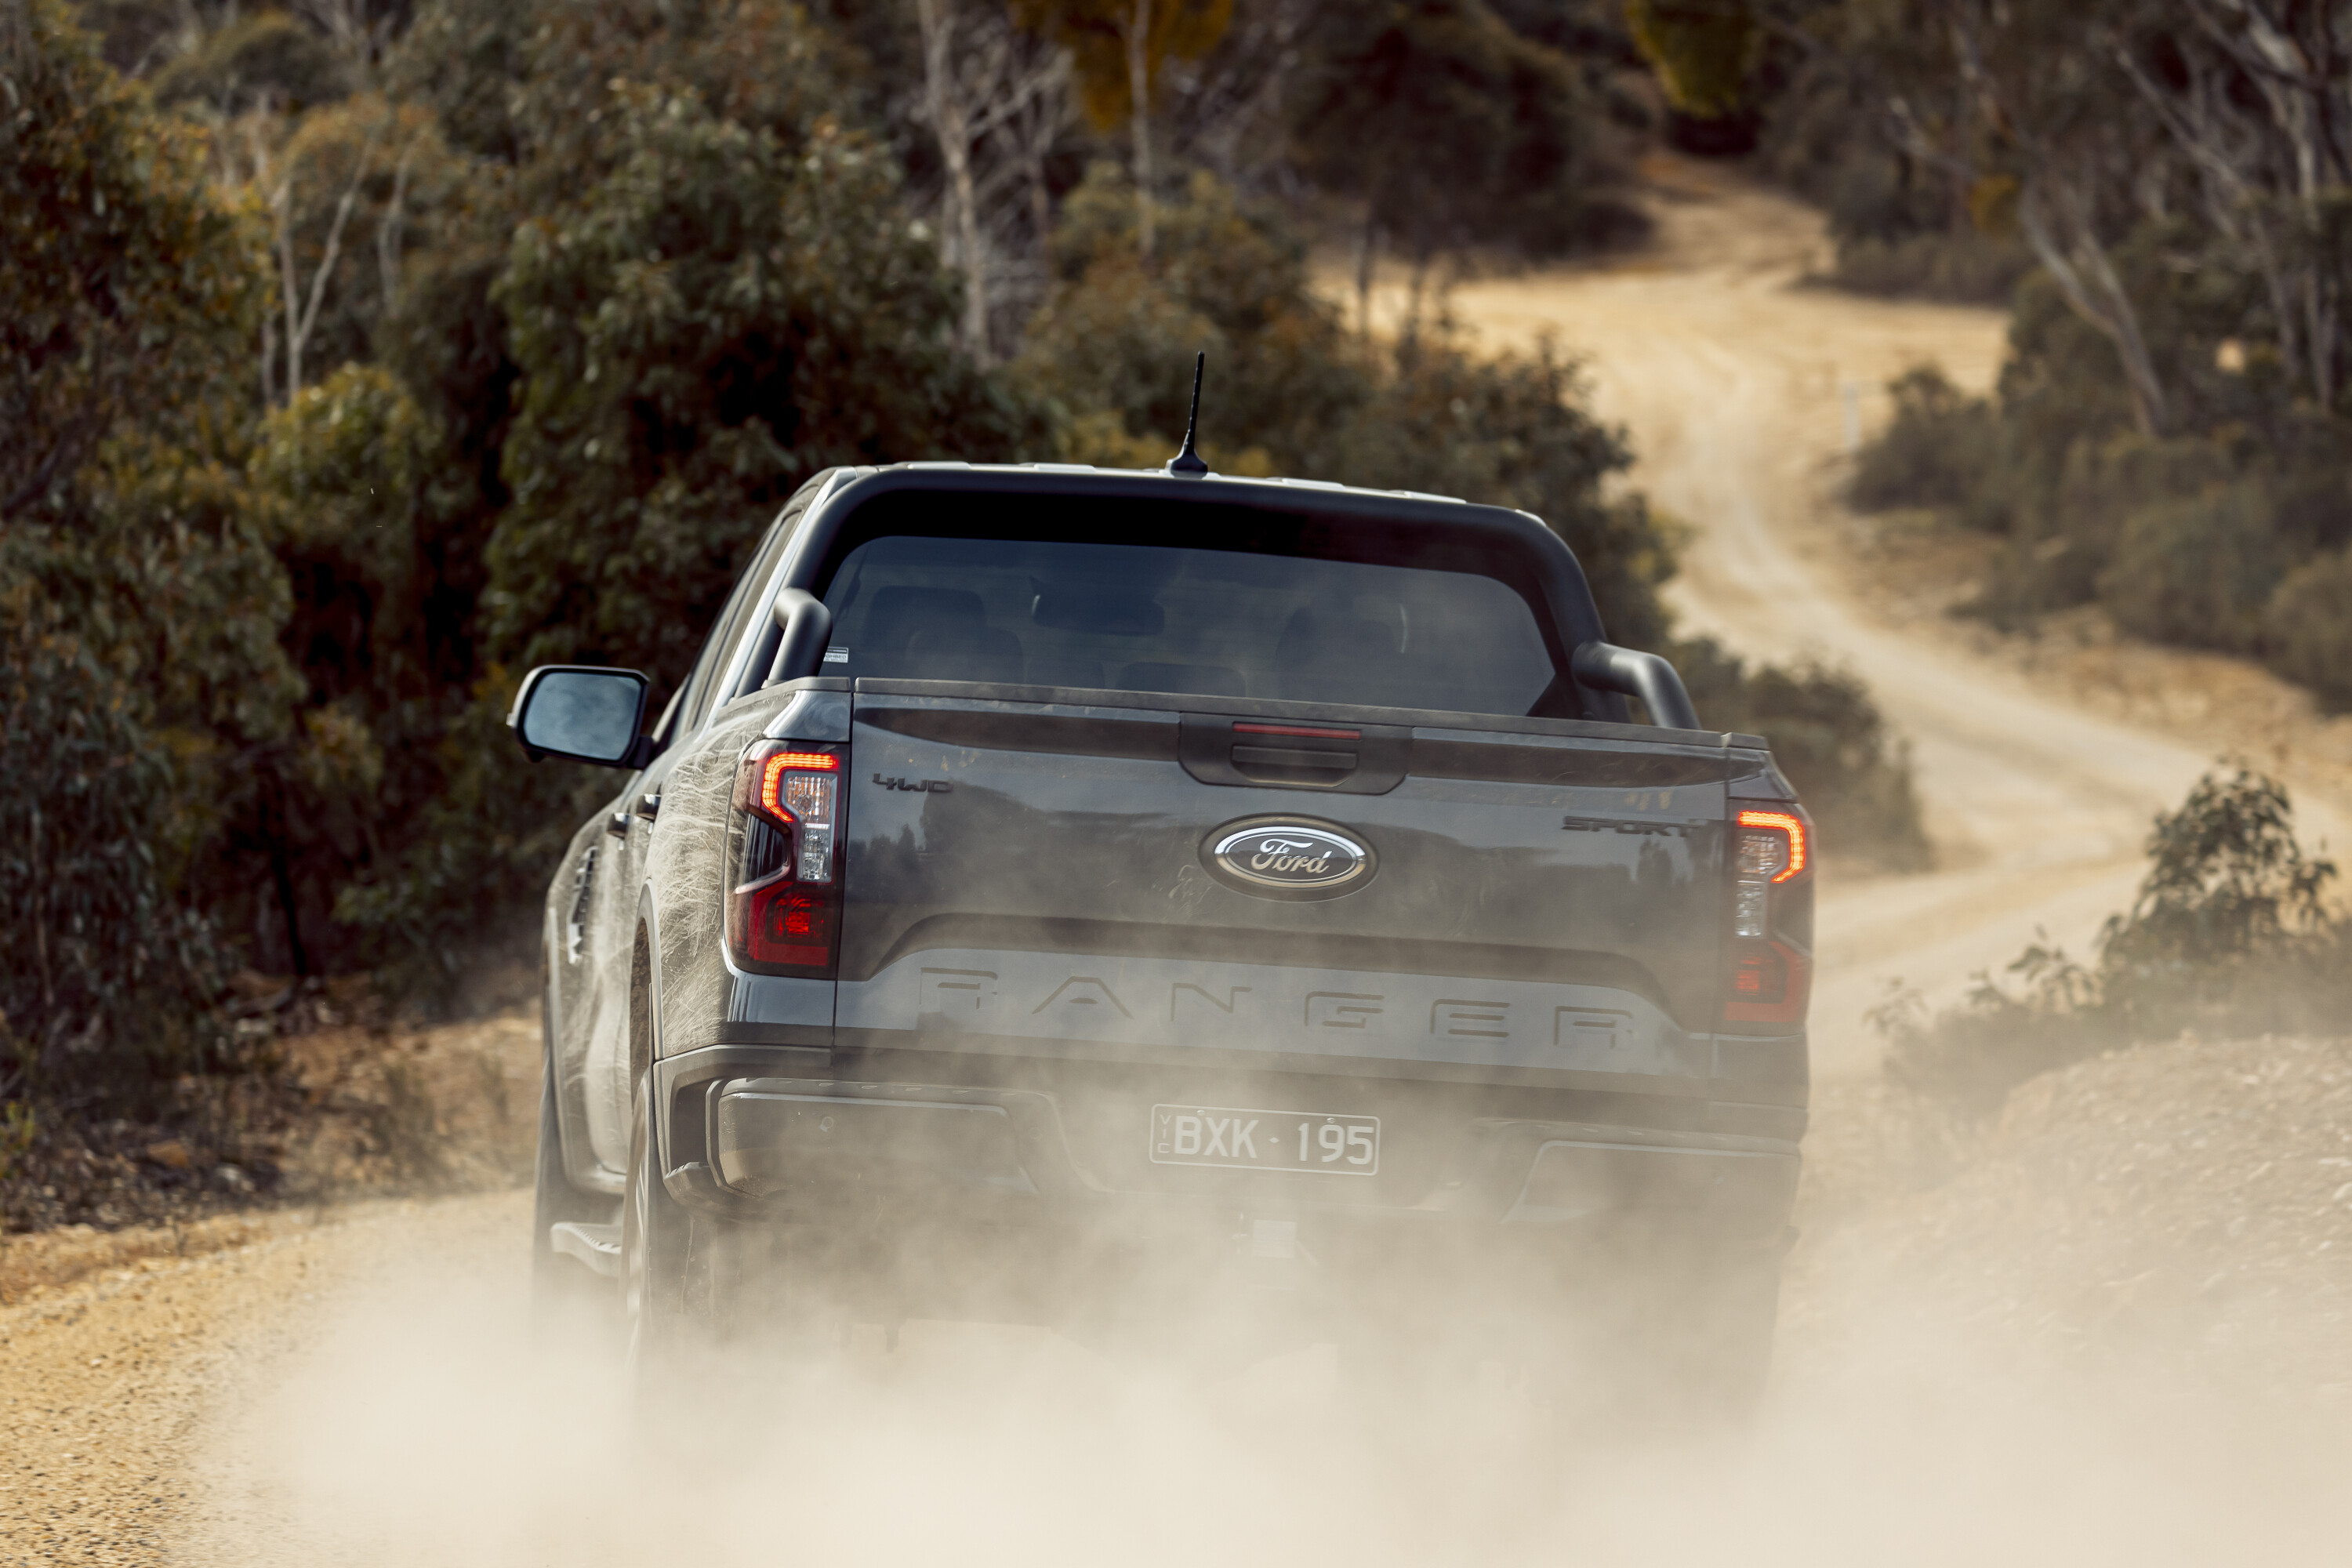
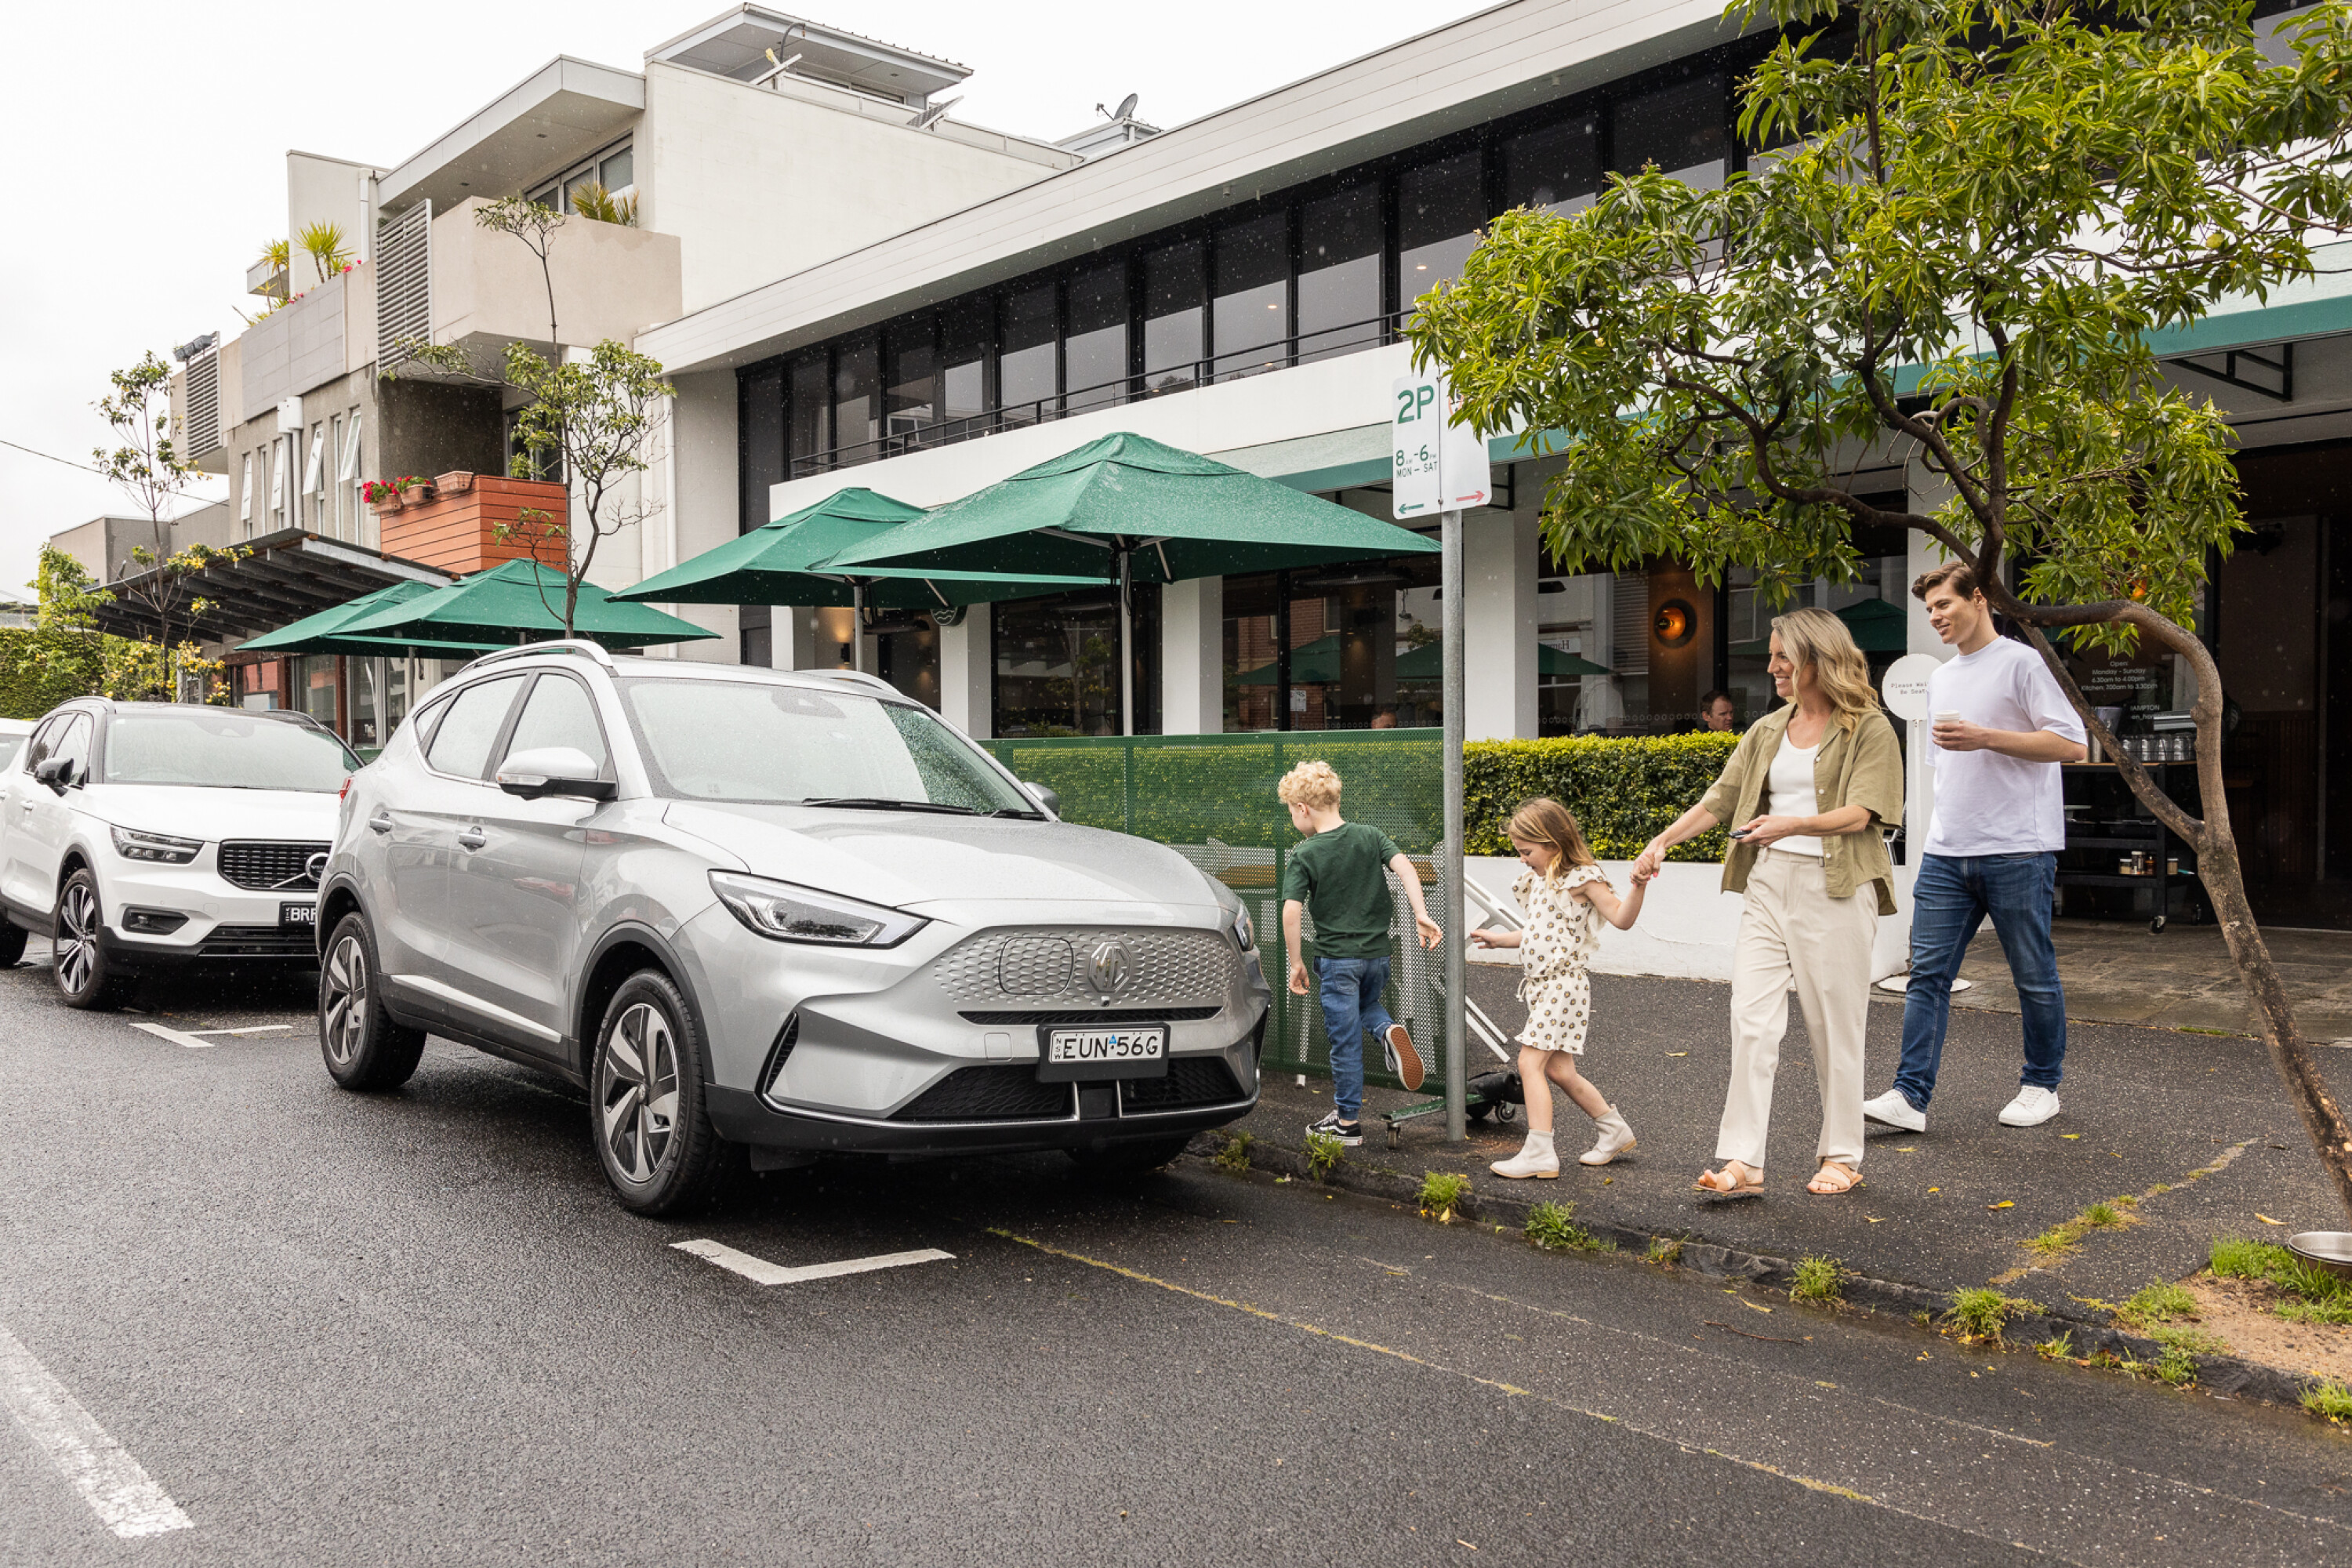
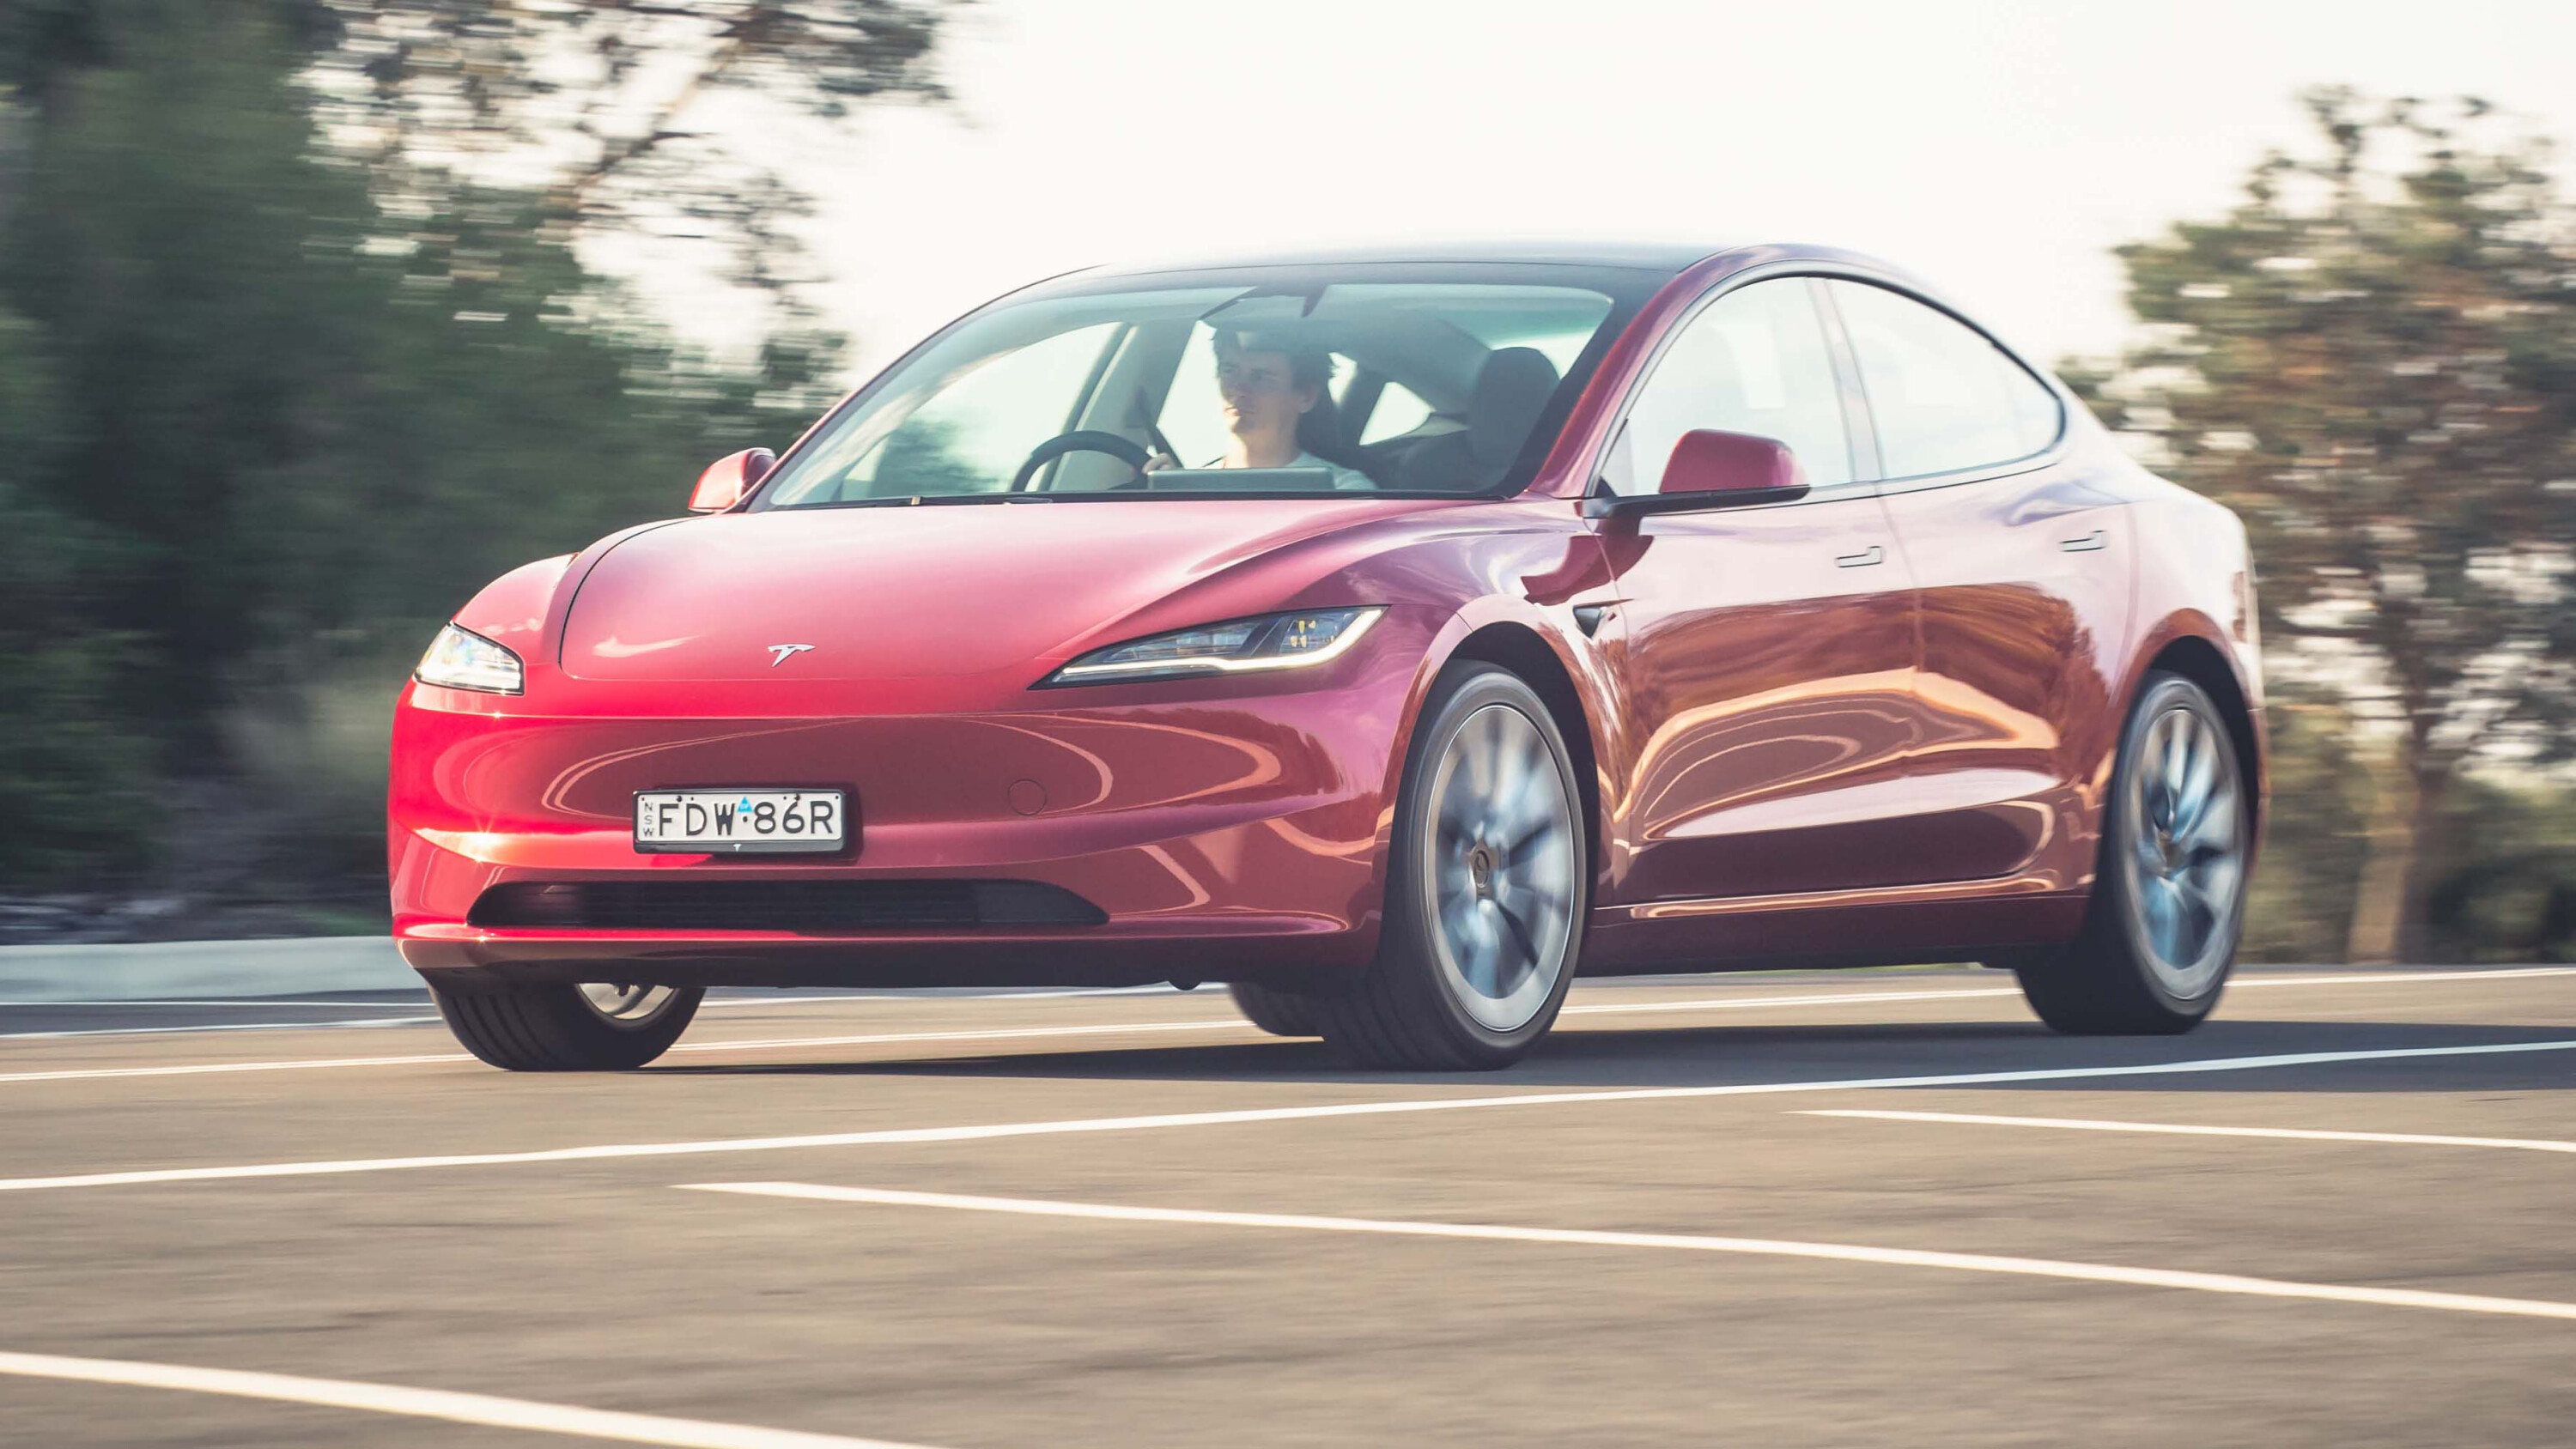
The Ford Ranger ute was the nation’s best-selling vehicle in July followed by the Toyota HiLux, both seemingly unaffected by changes to the instant asset write-off scheme introduced for this financial year. A pair of Chinese-built SUVs followed with the MG ZS just pipping the Tesla Model Y into third spot for the month, and year-to-date.
Toyota sales may be down 20.9% so far in 2023 but it still sold more than twice the amount of Mazda managed last month. Electric car sales eased slightly, too, falling behind hybrid registrations in July and accounting for 7.0% of the new-car market.
Why was it the best July ever?
Although there have been a lot of deliveries in the last few months, these are effectively delayed orders. FCAI chief executive, Tony Weber, cautioned that tightening economic conditions may have a knock-on effect in the coming months.
“During the past twelve months the issue has been one of securing supply for consumers, however as these pressures ease, we are starting to see a return to more stable market conditions.
“Many of these vehicles were ordered several months ago, so it is important to monitor the broader economic conditions through 2023 and their impact on private and business demand”, said Mr Weber.
JUMP AHEAD
- Top 10 models
- Top 10 brands
- Sales by segment
- Sales by fuel type
- Sales by country of origin
- Sales in charts
? Australia’s top 10 cars for July 2023
The Ford Ranger lunged into first place ? last month and now sits just 881 units shy of the ? Toyota HiLux year-to-date.
MG showed a solid performance with the ZS small SUV (3852) scoring third spot ?, pushing the all-electric Tesla Model Y (3330) into fourth – both had a comfortable lead ahead of Toyota’s RAV4 stalwart (2750) that remains saddled by delivery delays.
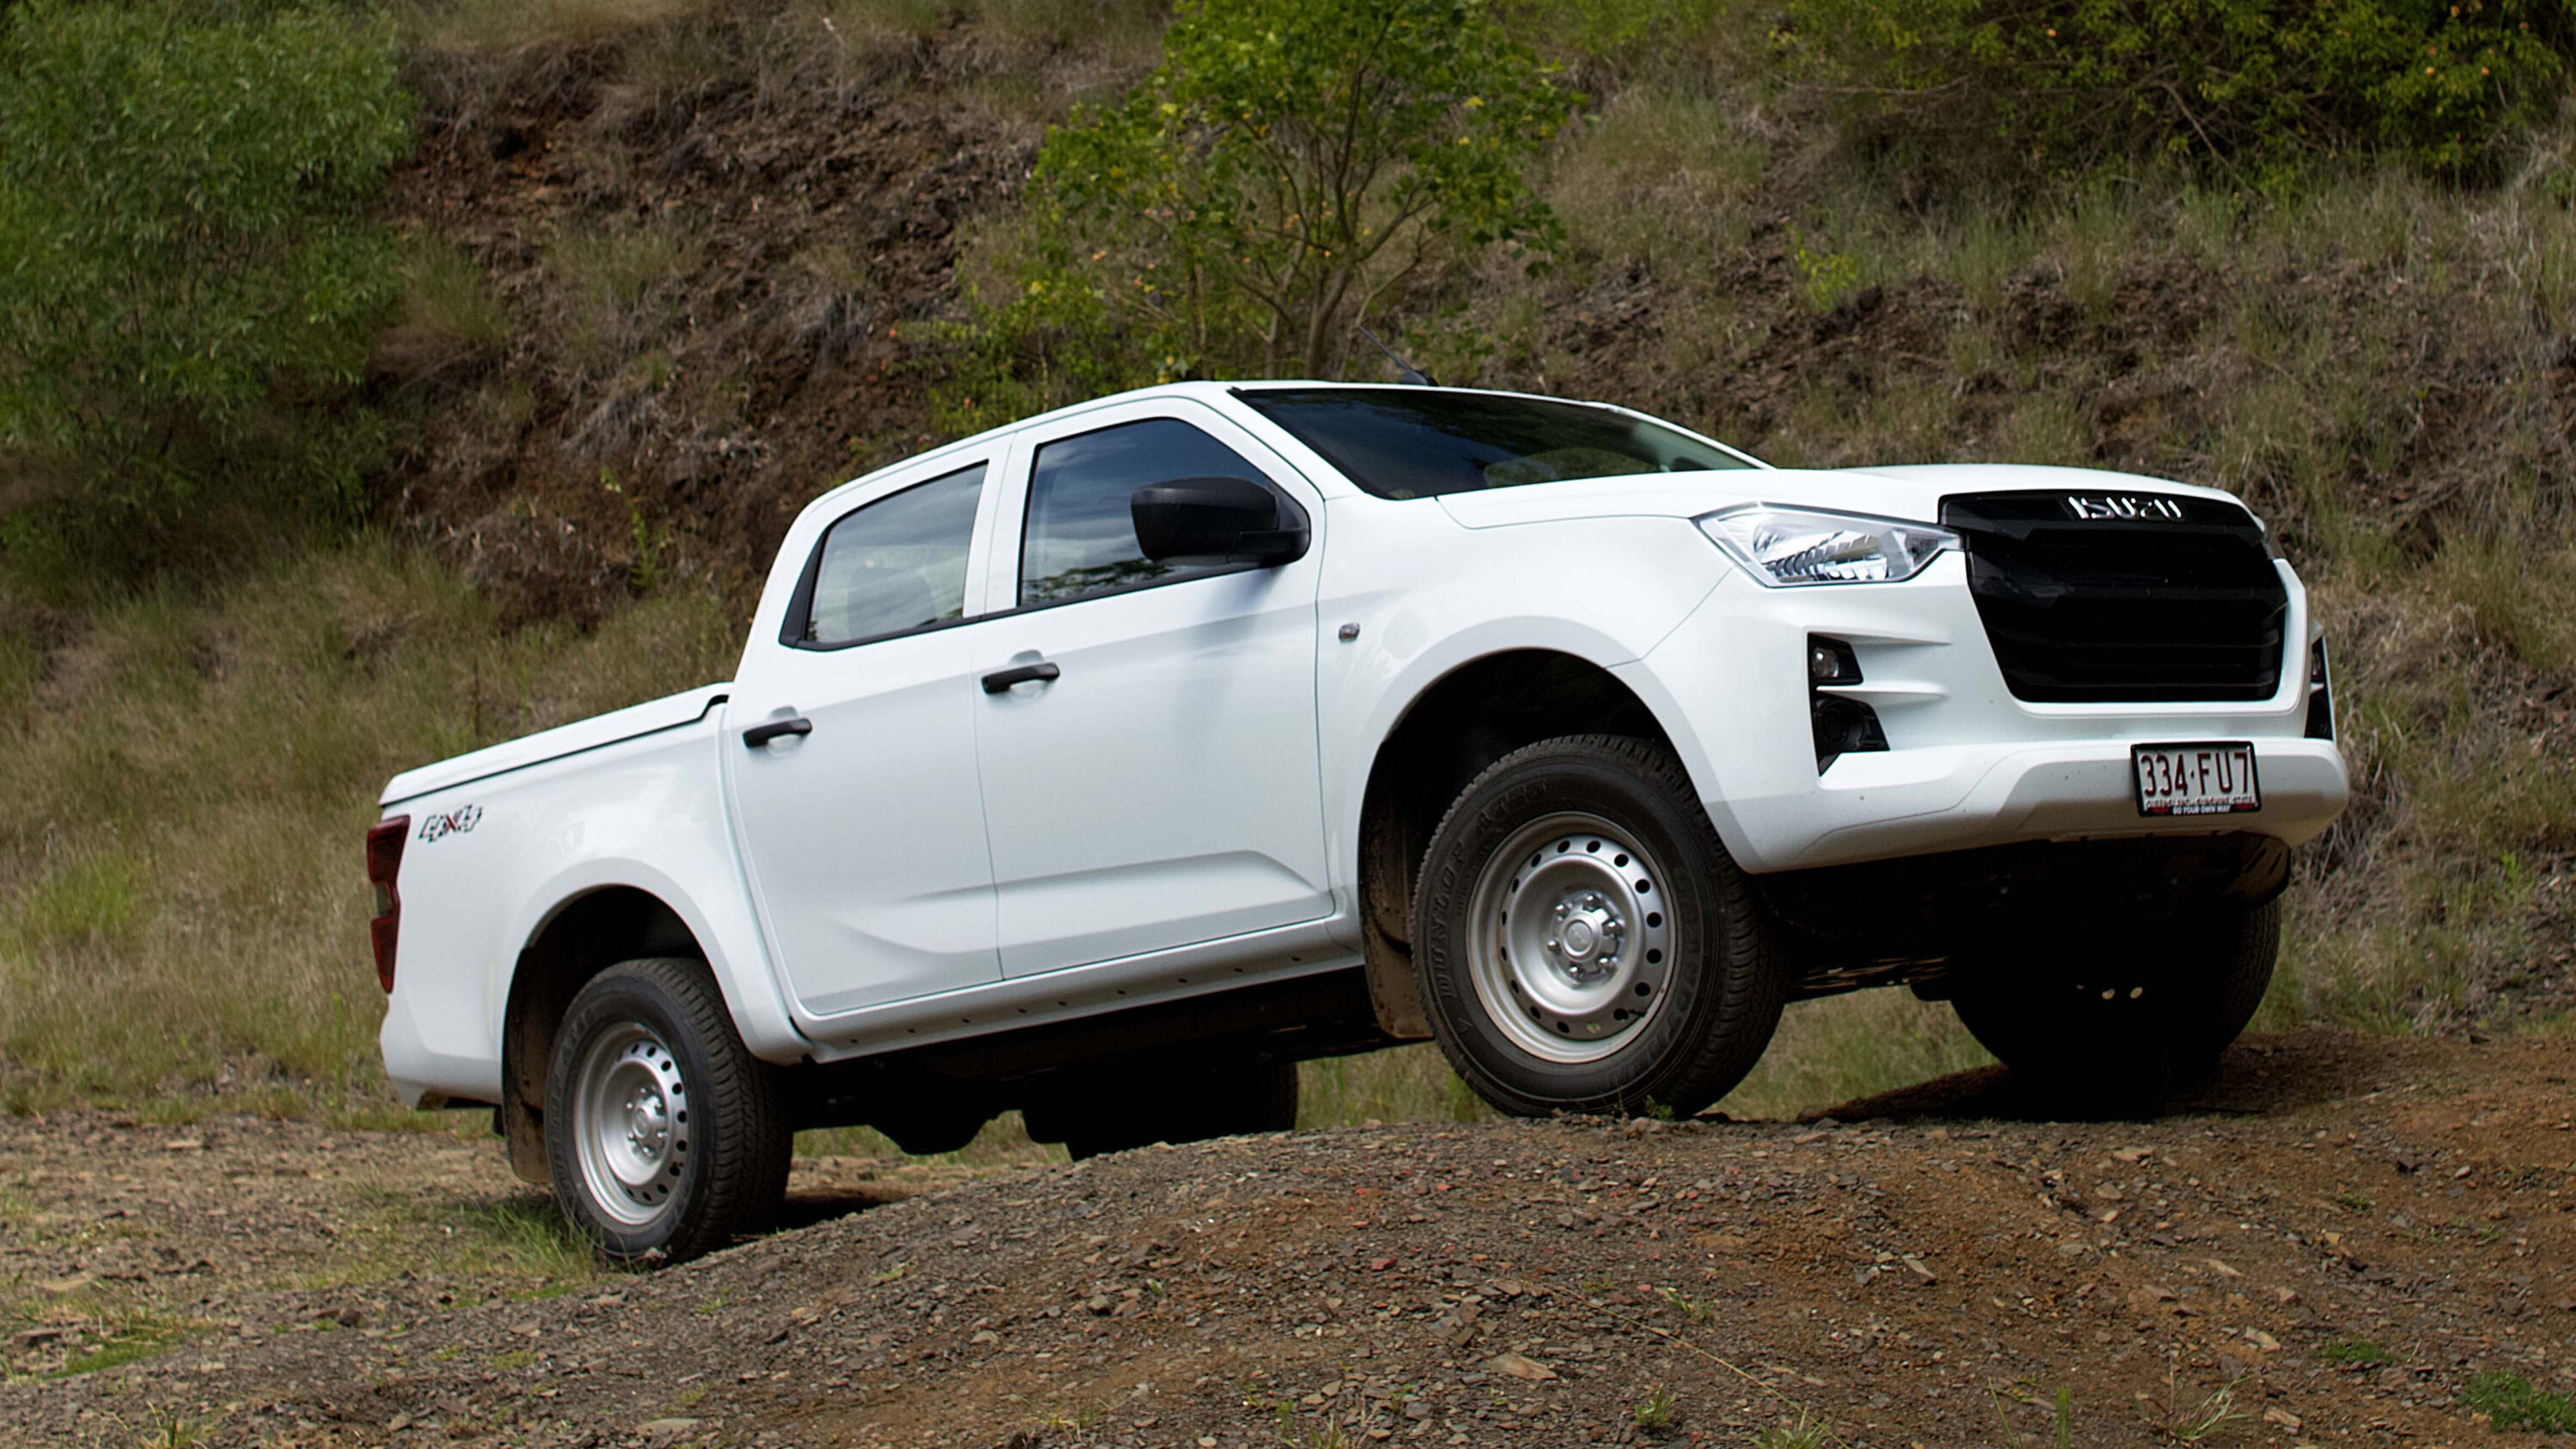
The Toyota Corolla took sixth spot and most-popular passenger car honours. It was followed by the Isuzu D-Max (2070), and Hyundai i30 (1865). The outgoing Toyota Prado performed very well last month in ninth spot with 1836 sales – a 75.4% improvement over July 2022.
Rounding out the top 10 was another classic family car in the Mitsubishi Outlander, with 1778 units representing a 35.7% improvement on last July. Just behind that was a pair of rivals – the Hyundai Tucson (1662) and Mazda CX-5.
In tables: Top 10 models for July 2023
| Rank | Model | Jul-23 | Jul-22 | Variance |
|---|---|---|---|---|
| 1 | Ford Ranger | 5143 | 2934 | 75.3% |
| 2 | Toyota Hilux | 4670 | 6441 | -27.5% |
| 3 | MG ZS | 3852 | 1229 | 213.4% |
| 4 | Tesla Model Y | 3330 | 0 | – |
| 5 | Toyota RAV4 | 2750 | 2437 | 12.8% |
| 6 | Toyota Corolla | 2145 | 1982 | 8.2% |
| 7 | Isuzu Ute D-Max | 2070 | 1930 | 7.3% |
| 8 | Hyundai i30 | 1865 | 1758 | 6.1% |
| 9 | Toyota Prado | 1836 | 1047 | 75.4% |
| 10 | Mitsubishi Outlander | 1778 | 1310 | 35.7% |
In tables: Top 10 model year-to-date 2023
| Rank | Model | YTD 23 | YTD 22 | Variance |
|---|---|---|---|---|
| 1 | Toyota Hilux | 32,763 | 38,412 | -14.7% |
| 2 | Ford Ranger | 31,884 | 22,728 | 40.3% |
| 3 | MG ZS | 17,431 | 11,609 | 50.2% |
| 4 | Tesla Model Y | 17,332 | 0 | – |
| 5 | Toyota RAV4 | 16,273 | 22,810 | -28.7% |
| 6 | Isuzu Ute D-Max | 15,313 | 15,392 | -0.5% |
| 7 | Mazda CX-5 | 13,223 | 16,360 | -19.2% |
| 8 | Mitsubishi Outlander | 13,120 | 10,553 | 24.3% |
| 9 | Hyundai i30 | 13,079 | 13,510 | -3.2% |
| 10 | Hyundai Tucson | 12,411 | 9541 | 30.1% |
? Australia’s top 10 car brands for July 2023
Ups and downs ? ?
It was Toyota that again took first place with 19,191 sales. A dominant performance when compared to Mazda’s 8307 sales (? 5.4% from 7879) but one that still represents a 1.9% ? dip from the same month last year, and a 20.9% deficit to make up year-to-date.
Following was Ford (7109 ? a massive 60.1%), Hyundai (6521 ? 4.0%), Kia (6150 ? 8.4%), while a strong performance from MG (5347 ? 77.2%)put the Chinese-owned brand in sixth.
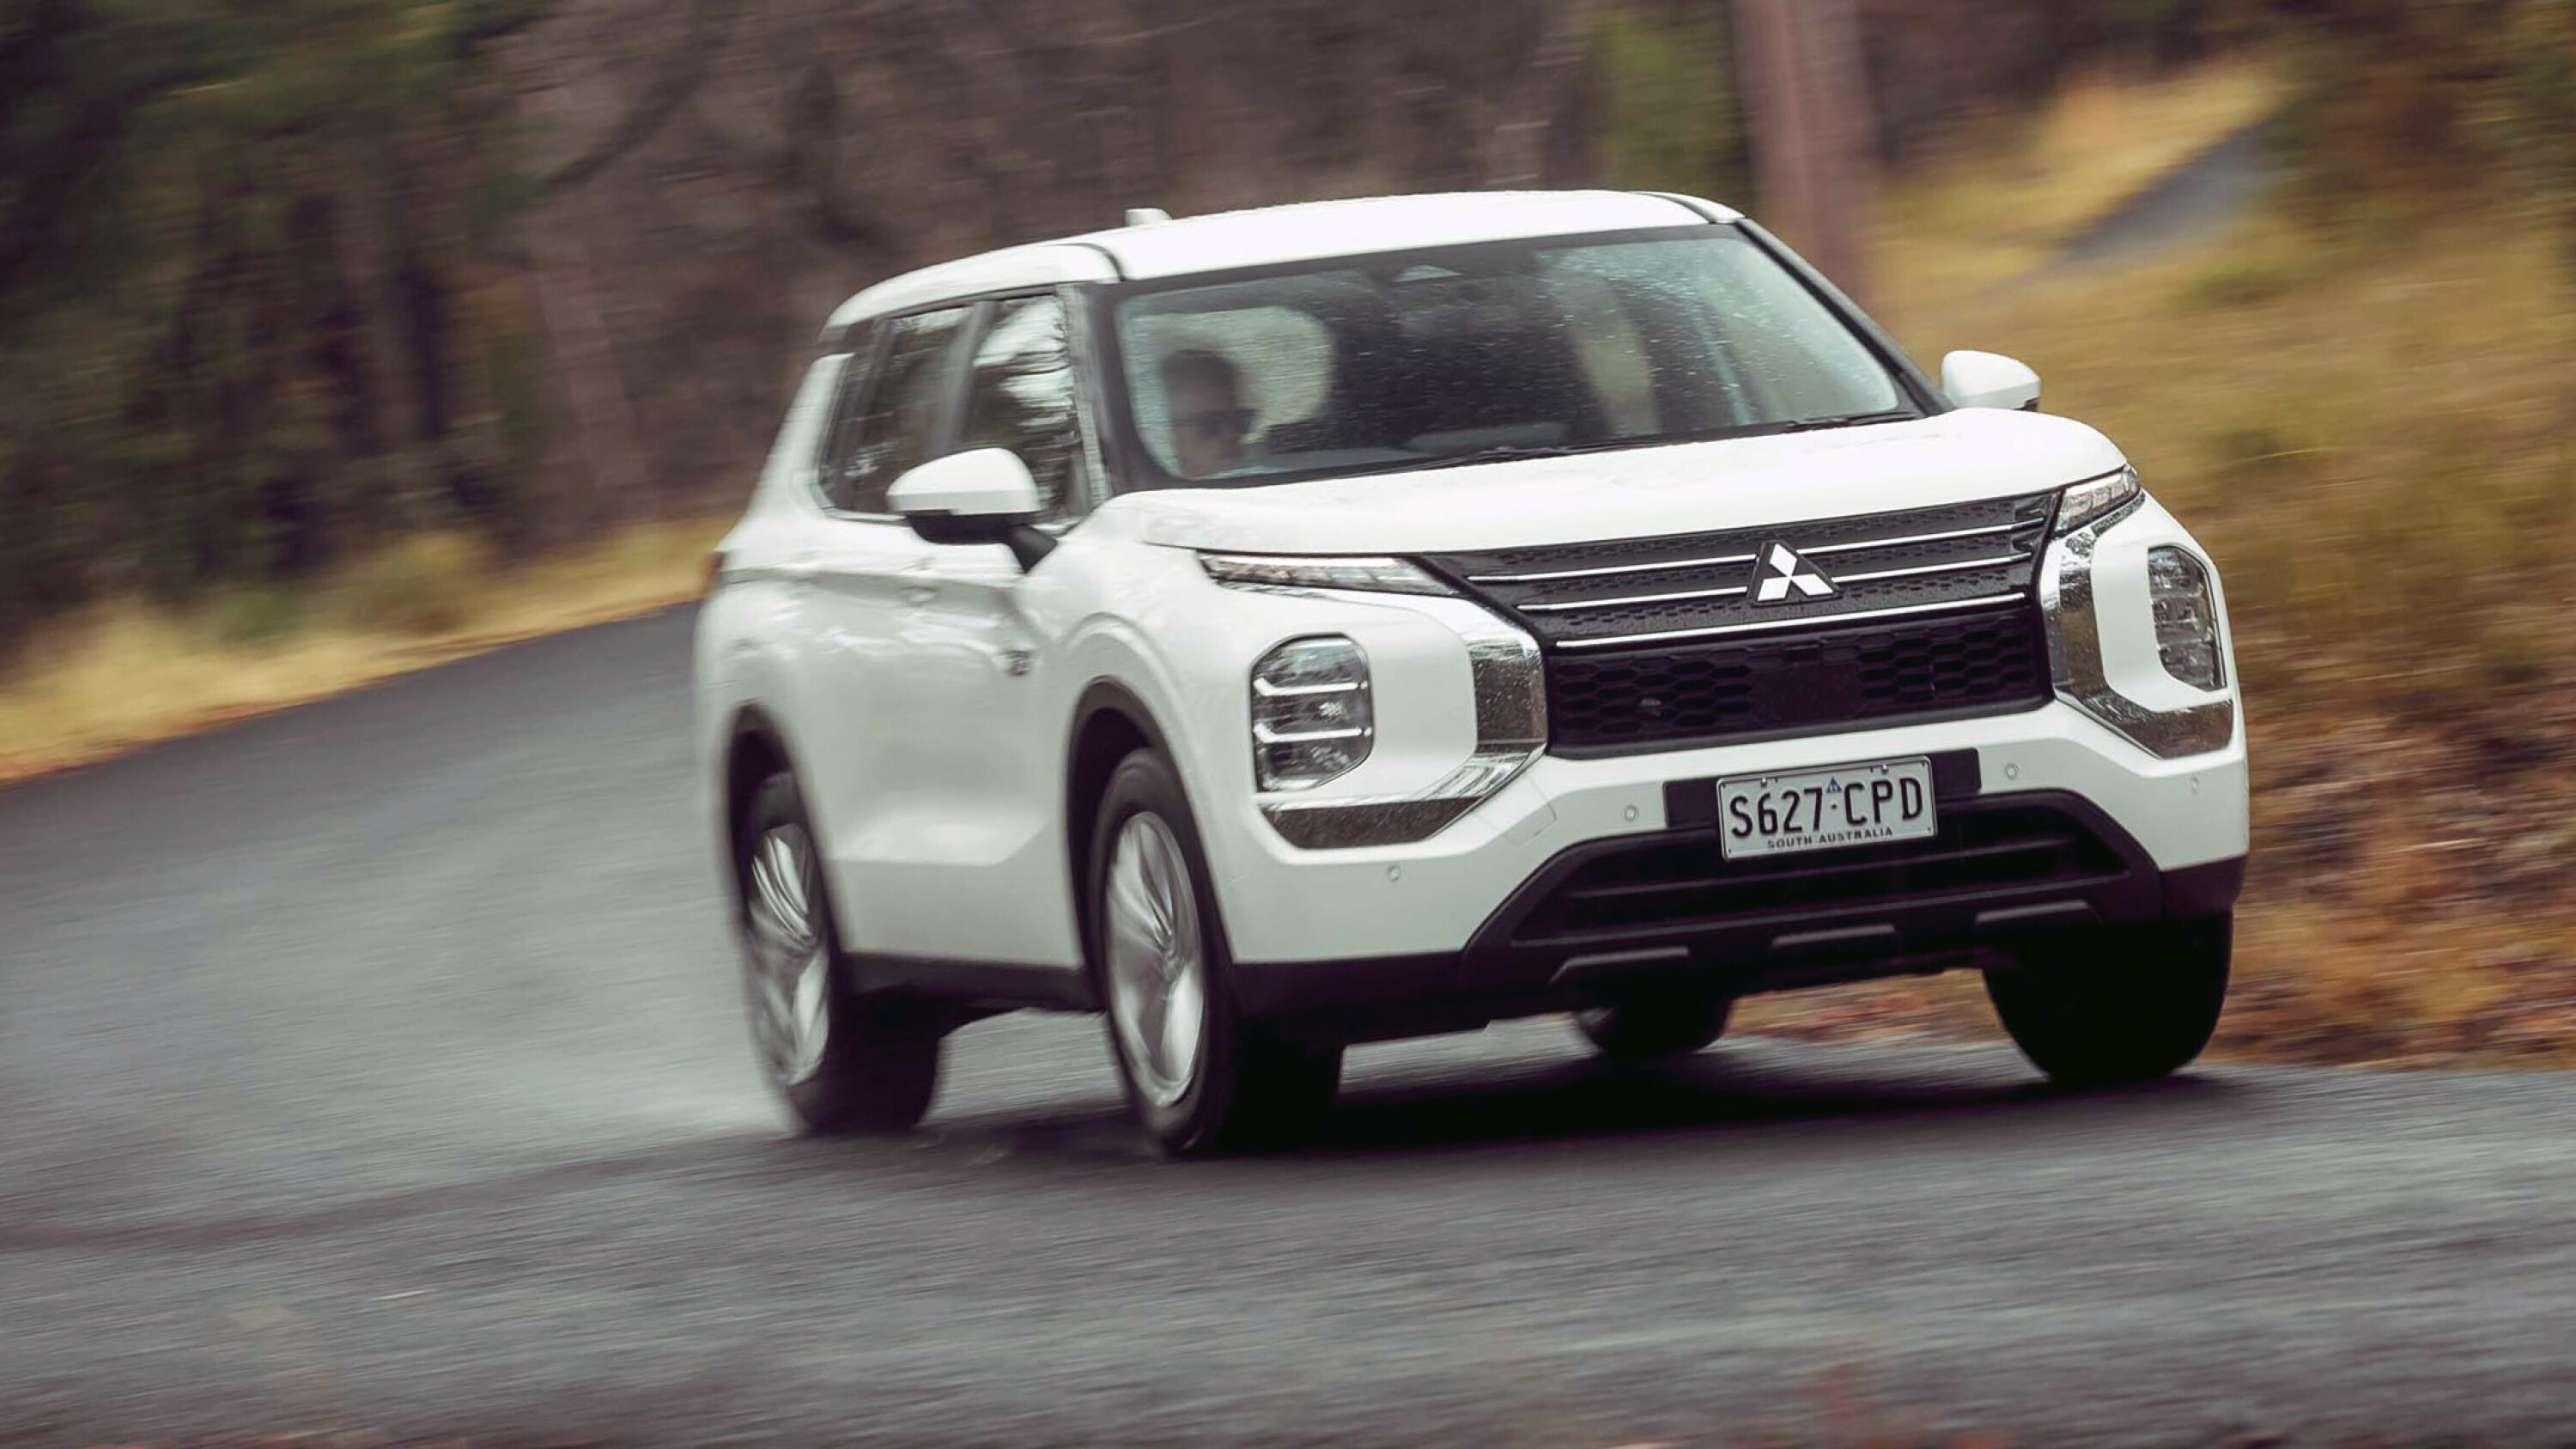
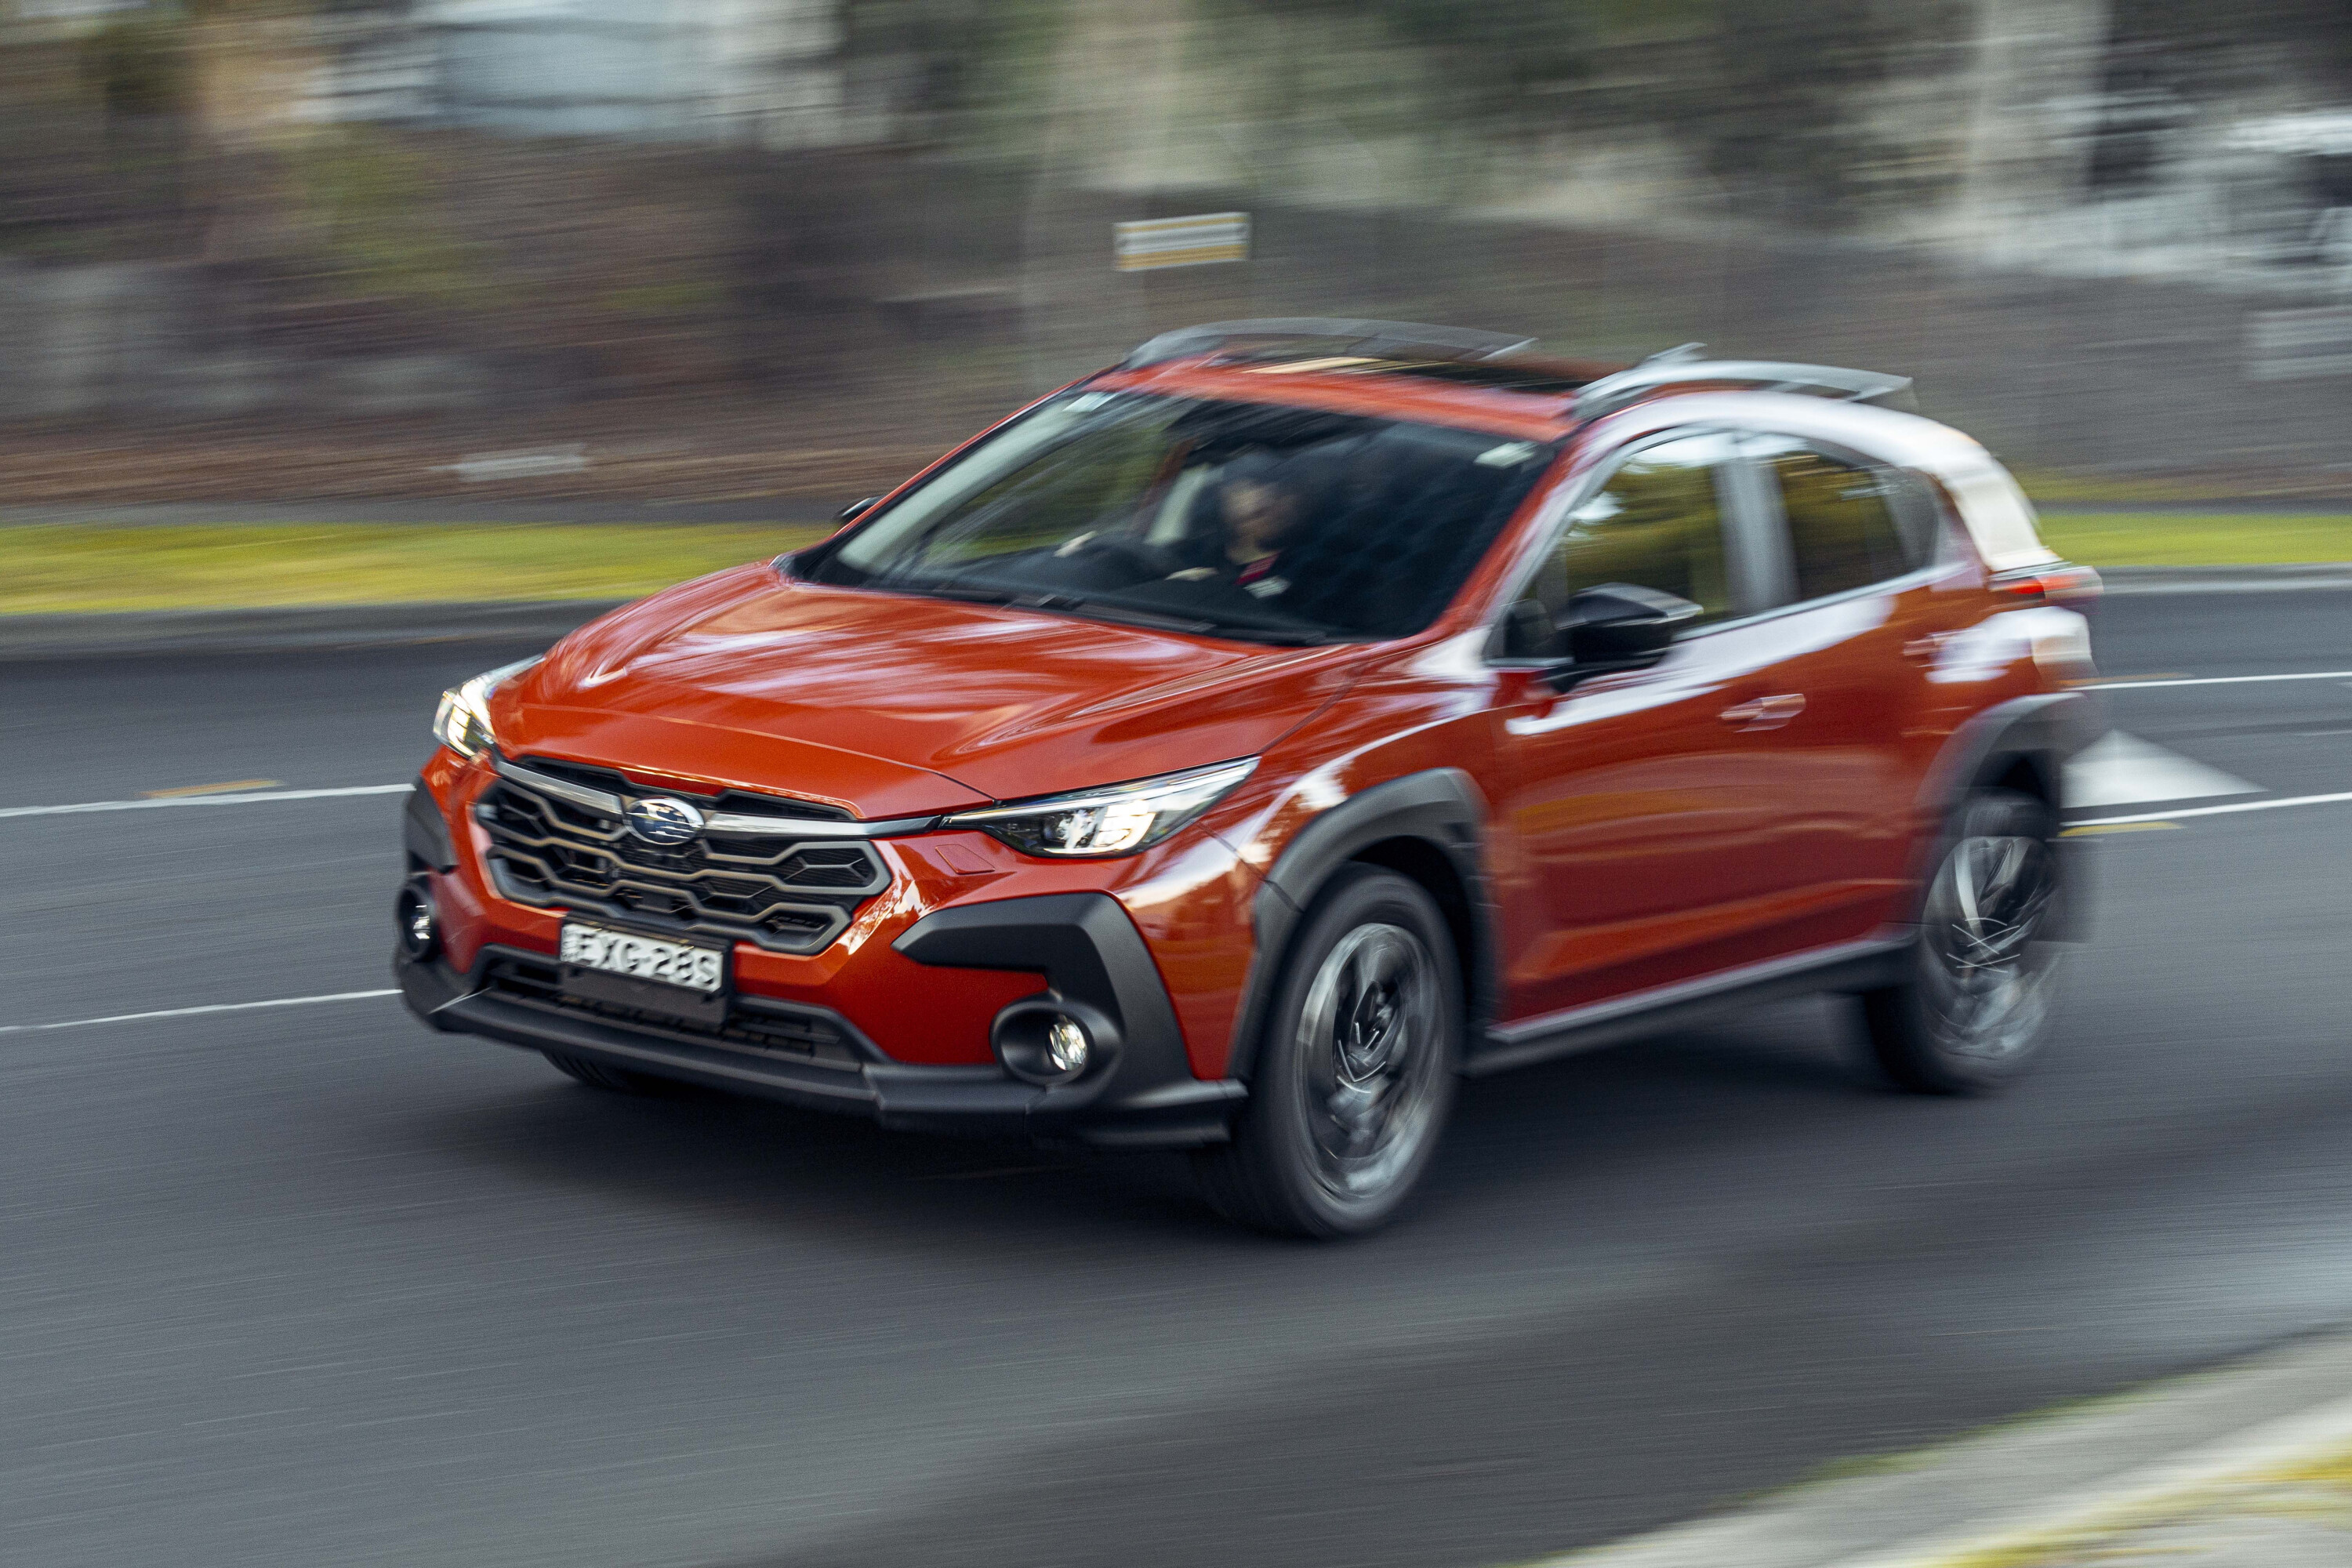
Mitsubishi was next (4143 ? 26.2%) as Triton sales slow towards its end-of-life, then EV-only Tesla (3934 %) which has firmly cemented itself in eighth position overall. Ninth was Subaru bolstered by the arrival of the new Crosstrek (née XV) with 3553 sales last month.
Volkswagen holds 10th in year-to-date numbers, but was left out in the cold despite supply improvements, and has a slim 241-sale margin to Isuzu. After a pumping June, GWM sales dropped a little to 2564 for July, holding a steady 12th spot in the figures.
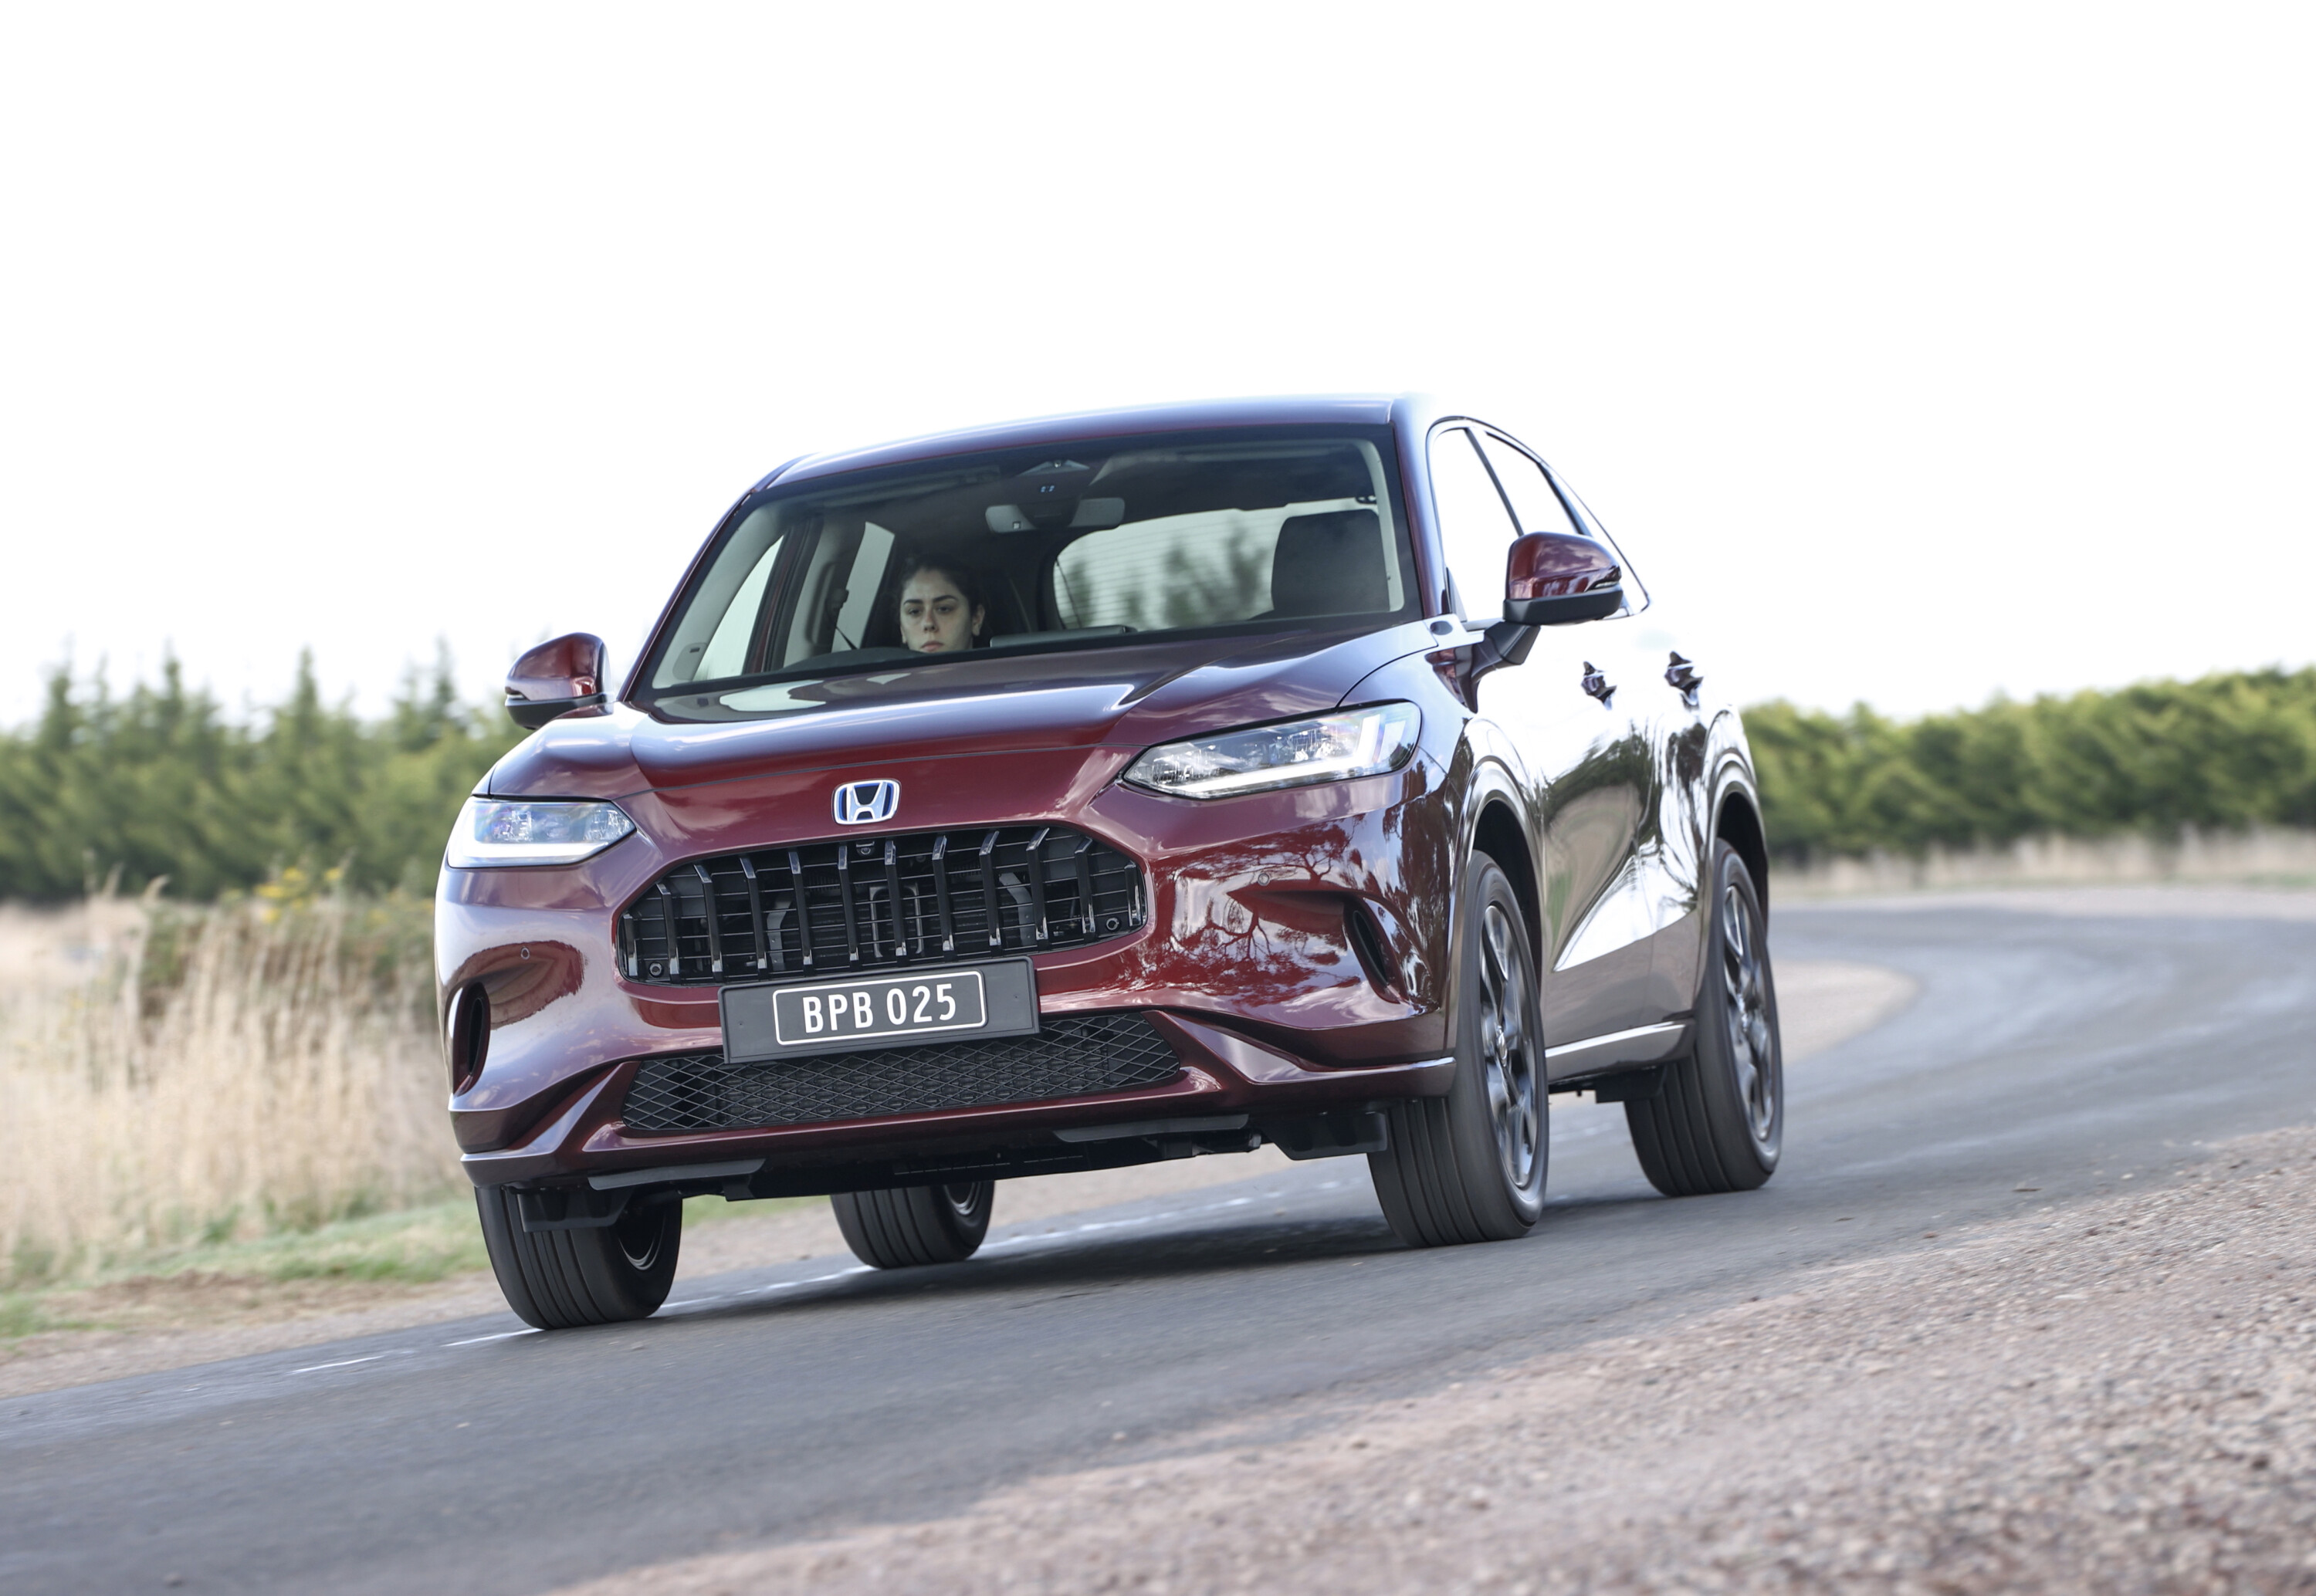
The new ZR-V hasn’t kicked into blossoming Honda sales yet, with just 930 deliveries last month – a stagnant performance from 2022 with just two more vehicles registered, and it’s down 10.1% year-to-date.
In tables: Top 10 brands for July 2023
| Rank | Model | Jul-23 | Jul-22 | Variance |
|---|---|---|---|---|
| 1 | Toyota | 19,191 | 19,565 | -1.9% |
| 2 | Mazda | 8307 | 7879 | 5.4% |
| 3 | Ford | 7109 | 4439 | 60.1% |
| 4 | Hyundai | 6521 | 6792 | -4.0% |
| 5 | Kia | 6150 | 6711 | -8.4% |
| 6 | MG | 5347 | 3018 | 77.2% |
| 7 | Mitsubishi | 4143 | 5611 | -26.2% |
| 8 | Tesla | 3934 | 4 | >999% |
| 9 | Subaru | 3553 | 2822 | 25.9% |
| 10 | Isuzu Ute | 3340 | 2748 | 21.5% |
In tables: Top 10 brands year-to-date 2023
| Rank | Brand | YTD 2023 | YTD 2022 | Variance YTD |
|---|---|---|---|---|
| 1 | Toyota | 111,426 | 140,942 | -20.9% |
| 2 | Mazda | 58,731 | 57,811 | 1.6% |
| 3 | Ford | 45,291 | 33,001 | 37.2% |
| 4 | Hyundai | 44,228 | 44,959 | -1.6% |
| 5 | Kia | 45,310 | 46,130 | -1.8% |
| 6 | MG | 32,039 | 27,525 | 16.4% |
| 7 | Mitsubishi | 34,992 | 47,359 | -26.1% |
| 8 | Tesla | 29,511 | 4657 | 533.7% |
| 9 | Subaru | 26,055 | 19,819 | 31.5% |
| 10 | Isuzu Ute | 23,697 | 21,537 | 10.0% |
And the rest…
| Make | Jul-23 | Jul-22 | YTD 23 | YTD 22 |
|---|---|---|---|---|
| Volkswagen | 2968 | 2022 | 23,938 | 15,077 |
| GWM | 2564 | 2127 | 20,112 | 10,684 |
| Nissan | 2399 | 2189 | 19,677 | 17,438 |
| Mercedes-Benz Cars | 2317 | 2848 | 17,406 | 19,258 |
| BMW | 1912 | 1866 | 14,414 | 13,759 |
| Suzuki | 1517 | 1792 | 10,331 | 13,038 |
| Lexus | 1390 | 536 | 8300 | 4473 |
| LDV | 1374 | 1218 | 12,624 | 8391 |
| Audi | 1308 | 1440 | 10,644 | 7748 |
| BYD | 1005 | 0 | 7201 | 0 |
| Honda | 930 | 928 | 7688 | 8549 |
| Volvo Car | 678 | 647 | 6968 | 6419 |
| Renault | 673 | 621 | 5098 | 5689 |
| Chery | 651 | 0 | 2263 | 0 |
| Skoda | 596 | 472 | 4563 | 3758 |
| Land Rover | 562 | 289 | 4276 | 2890 |
| Porsche | 552 | 306 | 3783 | 3468 |
| SsangYong | 476 | 364 | 3795 | 1807 |
| MINI | 439 | 320 | 2575 | 1957 |
| RAM | 378 | 426 | 4534 | 2998 |
| Polestar | 306 | 94 | 1453 | 656 |
| Jeep | 268 | 631 | 2937 | 4066 |
| Chevrolet | 240 | 167 | 1953 | 1170 |
| CUPRA | 221 | 49 | 1807 | 49 |
| Genesis | 190 | 89 | 1061 | 552 |
| Peugeot | 188 | 223 | 1374 | 1234 |
| Fiat Professional | 138 | 66 | 733 | 402 |
| Alfa Romeo | 76 | 31 | 343 | 326 |
| Maserati | 57 | 38 | 376 | 351 |
| Fiat | 50 | 17 | 463 | 314 |
| Jaguar | 41 | 58 | 279 | 471 |
| Lamborghini | 37 | 27 | 108 | 71 |
| Ferrari | 24 | 15 | 129 | 121 |
| Lotus | 24 | 0 | 76 | 62 |
| Bentley | 20 | 9 | 130 | 128 |
| Citroen | 19 | 16 | 135 | 188 |
| McLaren | 11 | 0 | 57 | 28 |
| Aston Martin | 5 | 8 | 92 | 76 |
| Rolls-Royce | 5 | 3 | 26 | 36 |
| Alpine | 0 | 0 | 0 | 4 |
| Chrysler | 0 | 1 | 0 | 77 |
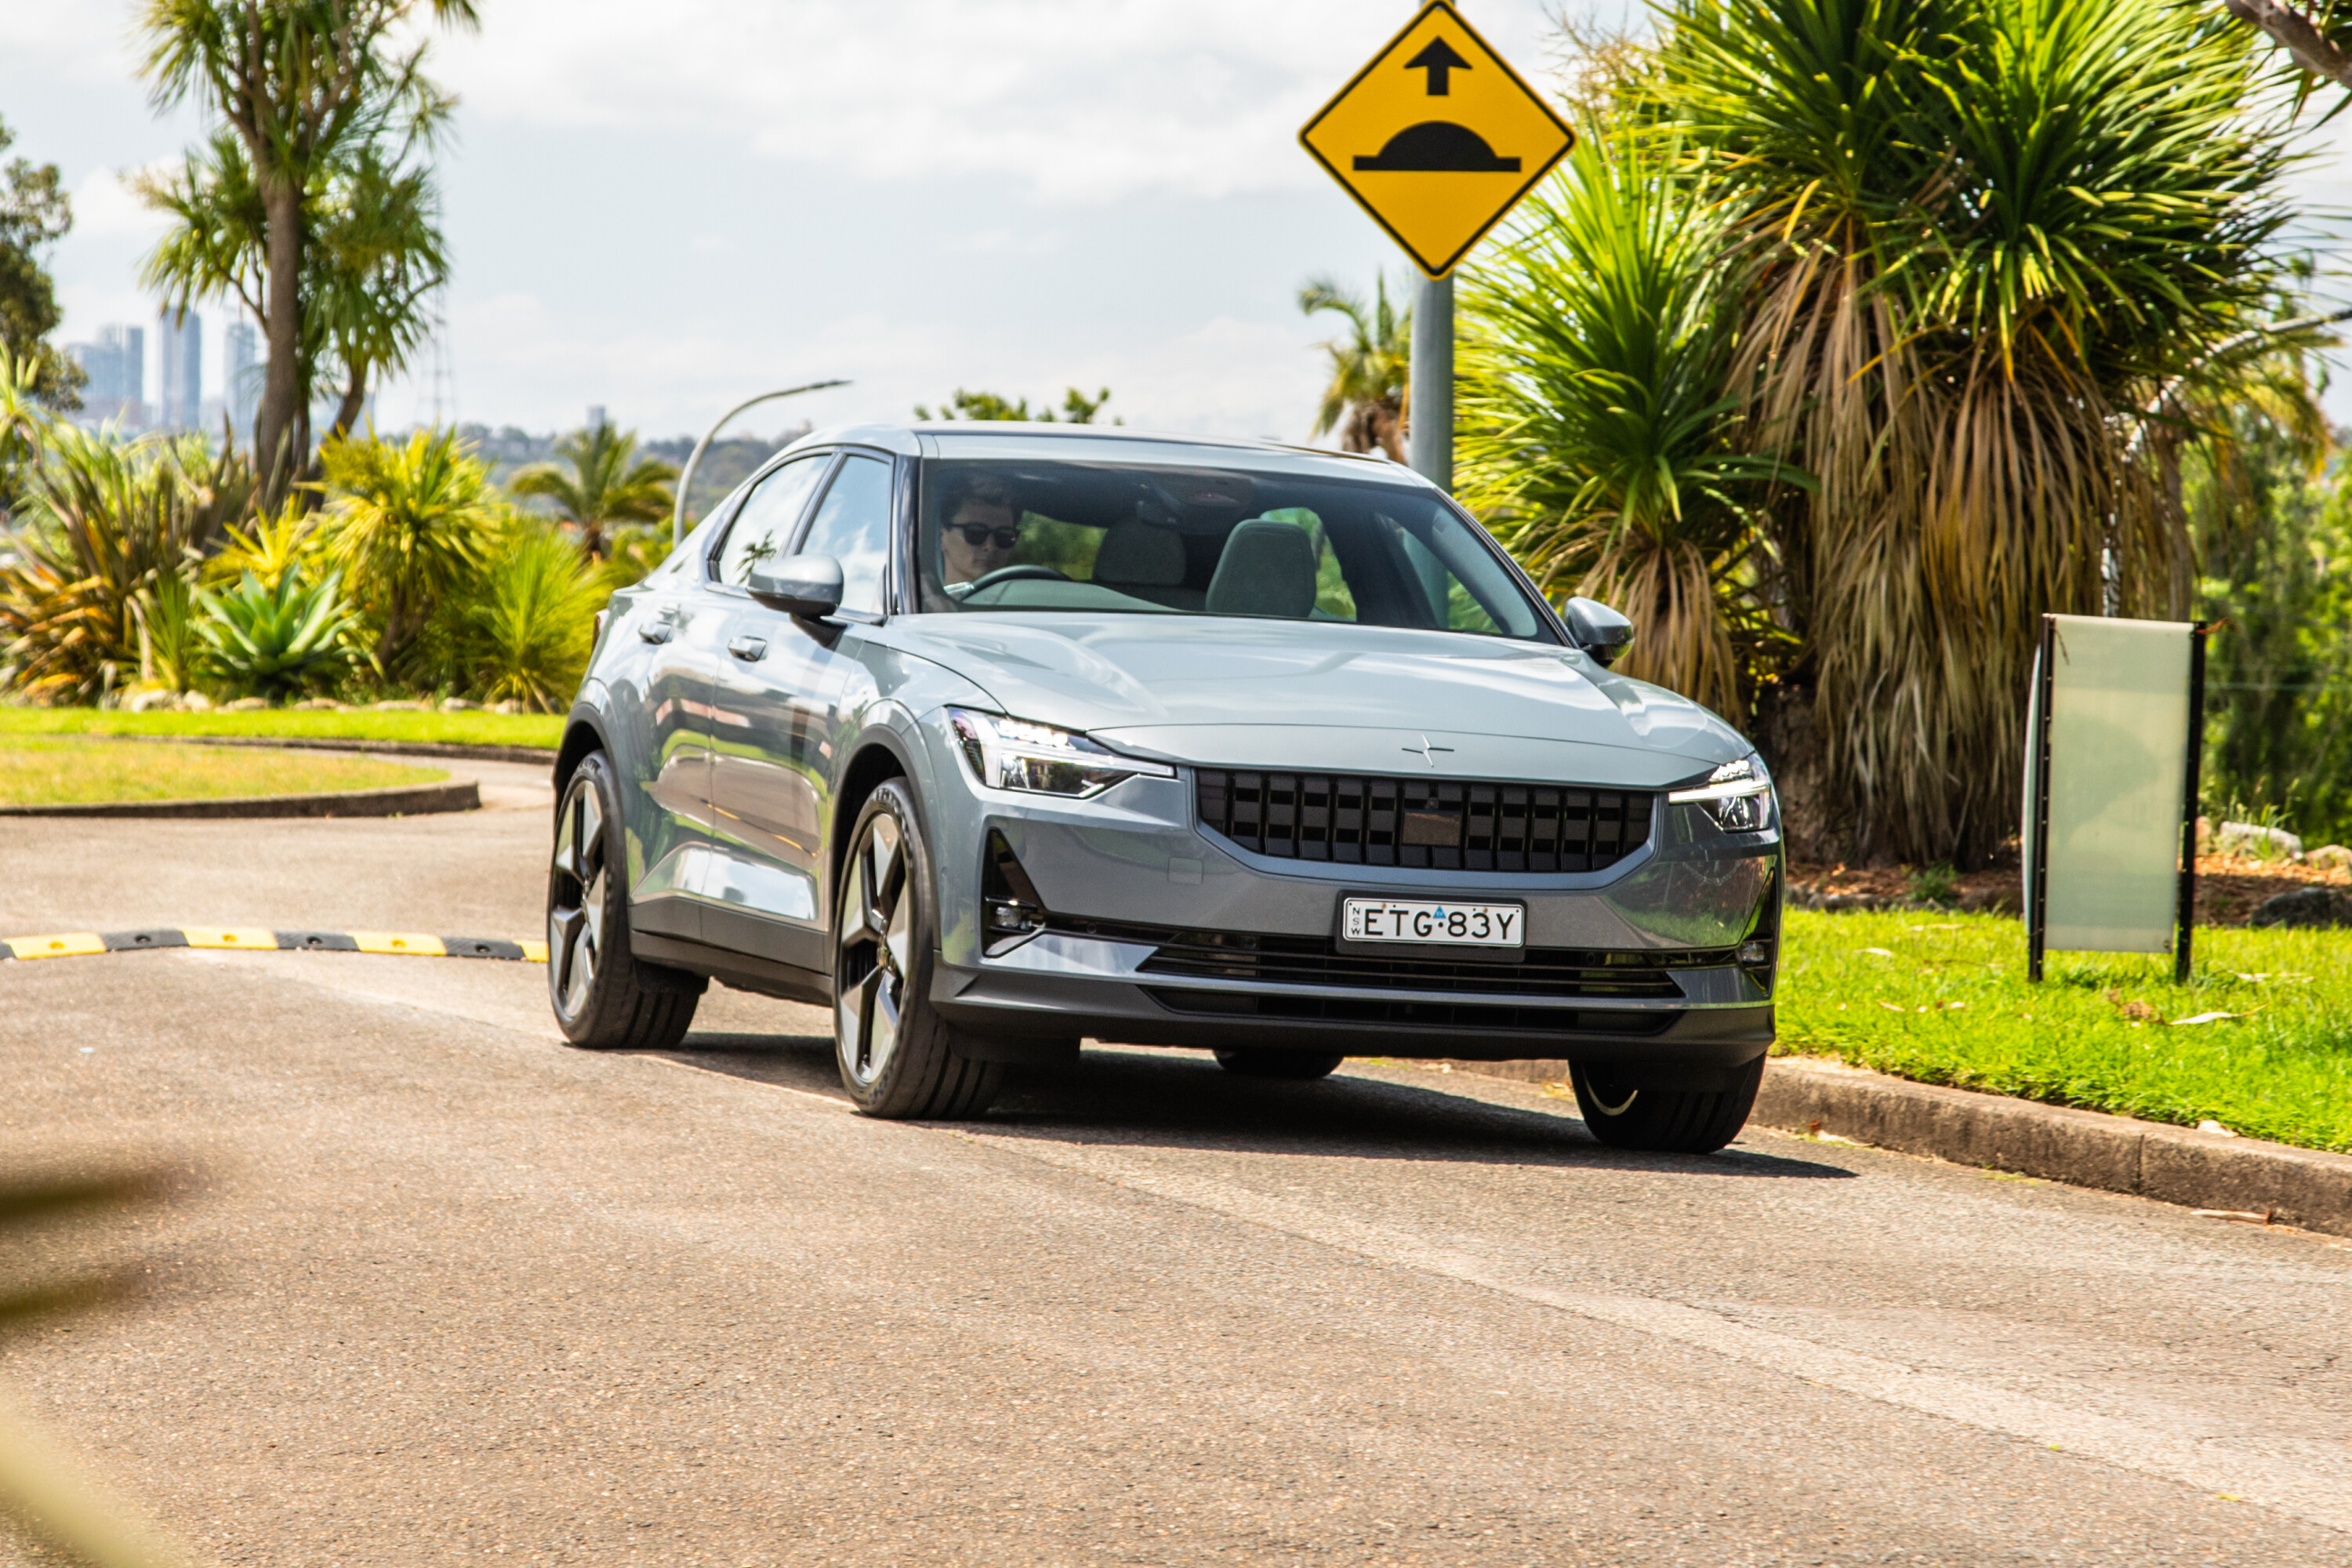
Size & Shape: Market segment results for July
The medium SUV remains the dominant choice in Australia, accounting for 22.7 per cent of all new-car sales in July 2023. It’s not a shrinking segment either, up 30.6% month-on-month, and 26.9% year-to-date.
Utes are the next-most popular category; combining 4×2 and 4×4 segments sees them in second (17,218) ahead of small SUVs (16310) and large SUVs (12,145) and then small passenger cars (6952).
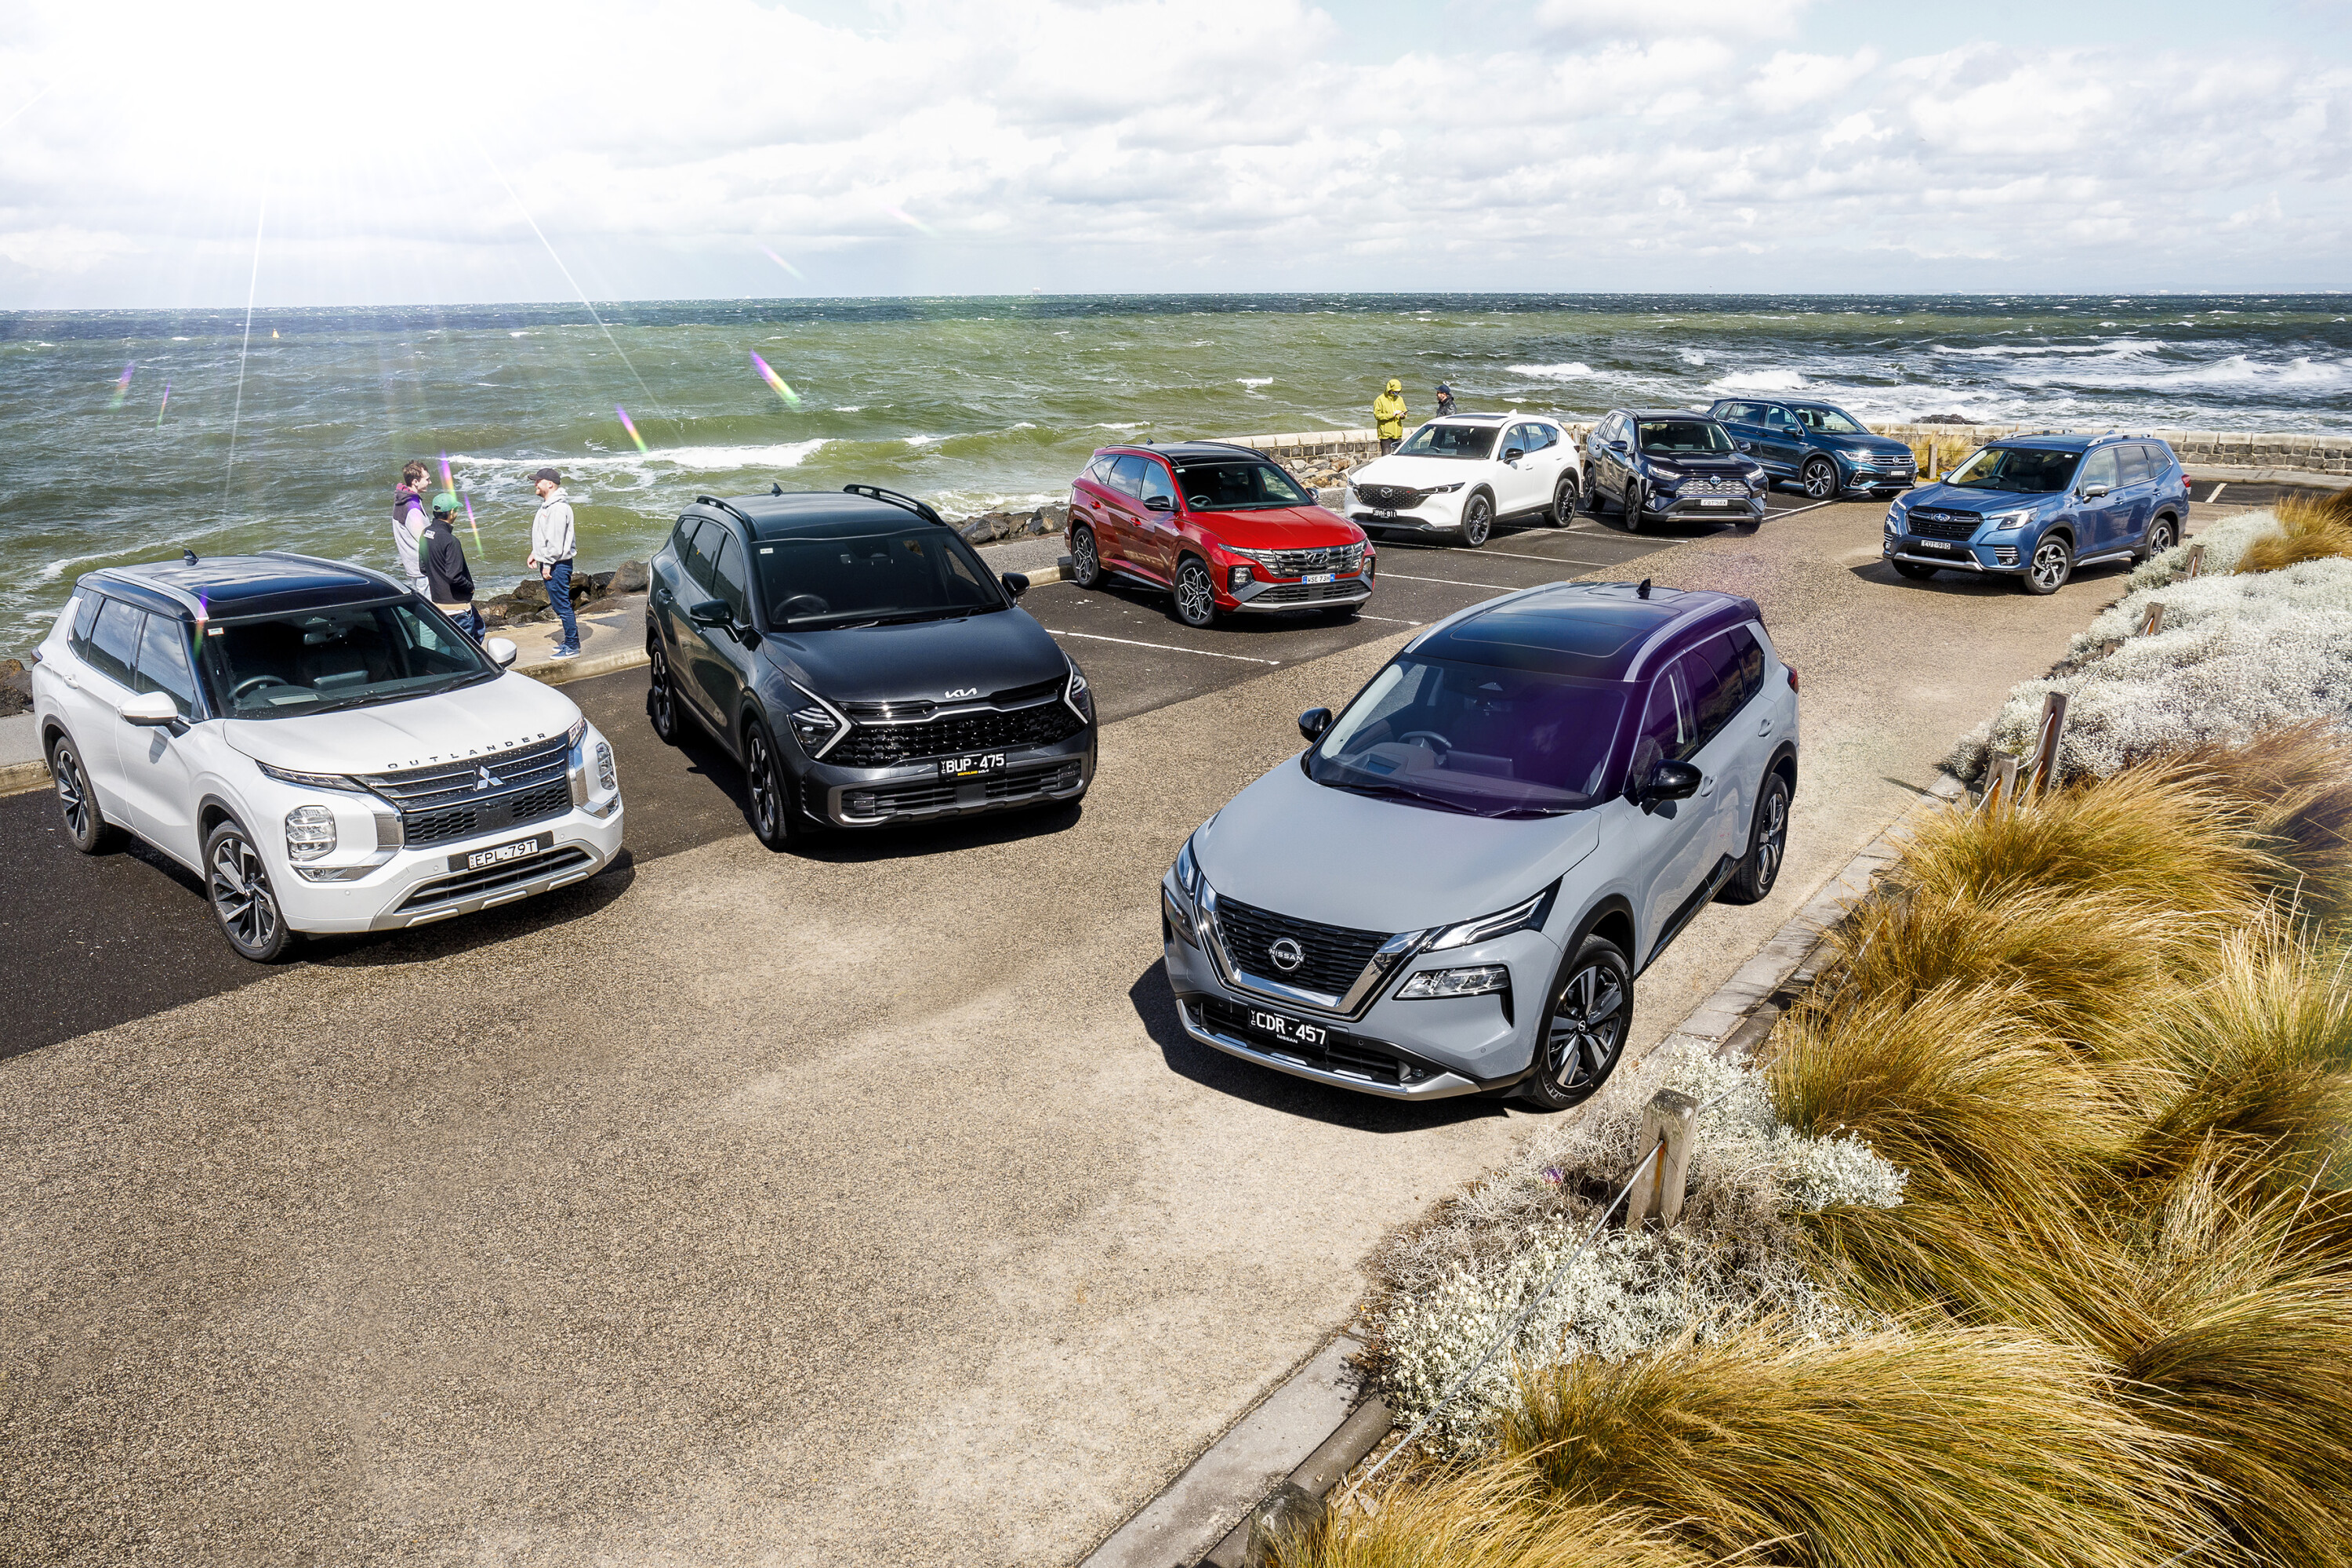
In tables: New car sales by segment and size for July 2023
| Segment | Jul-23 | Jul-22 | YTD 23 | YTD 22 |
|---|---|---|---|---|
| SUV Medium | 22,000 | 16,840 | 152,210 | 119,914 |
| PU/CC 4×2 + 4×4 | 17,218 | 17,377 | 127,017 | 128,393 |
| SUV Small | 16,310 | 10,906 | 96,256 | 80,054 |
| SUV Large | 12,145 | 10,846 | 84,756 | 82,628 |
| Small | 6952 | 7801 | 43,819 | 52,923 |
| SUV Light | 4460 | 4352 | 32,257 | 31,388 |
| Light | 3321 | 3060 | 24,067 | 27,403 |
| Medium | 3316 | 2440 | 29,441 | 21,033 |
| SUV Upper Large | 2088 | 1760 | 13,737 | 12,481 |
| People Movers | 1237 | 1142 | 8686 | 7082 |
| Vans/CC 2.5-3.5t | 1066 | 1791 | 12,140 | 13,681 |
| Sports | 1064 | 704 | 6835 | 4689 |
| Micro | 873 | 499 | 4558 | 3626 |
| $100K”}”>Pick-Up/CC > $100K | 595 | 569 | 6319 | 4030 |
| Large | 352 | 340 | 3388 | 3474 |
| Light Buses | 263 | 216 | 1606 | 1951 |
| Vans/cc | 66 | 66 | 607 | 1026 |
| Upper Large | 41 | 62 | 289 | 385 |
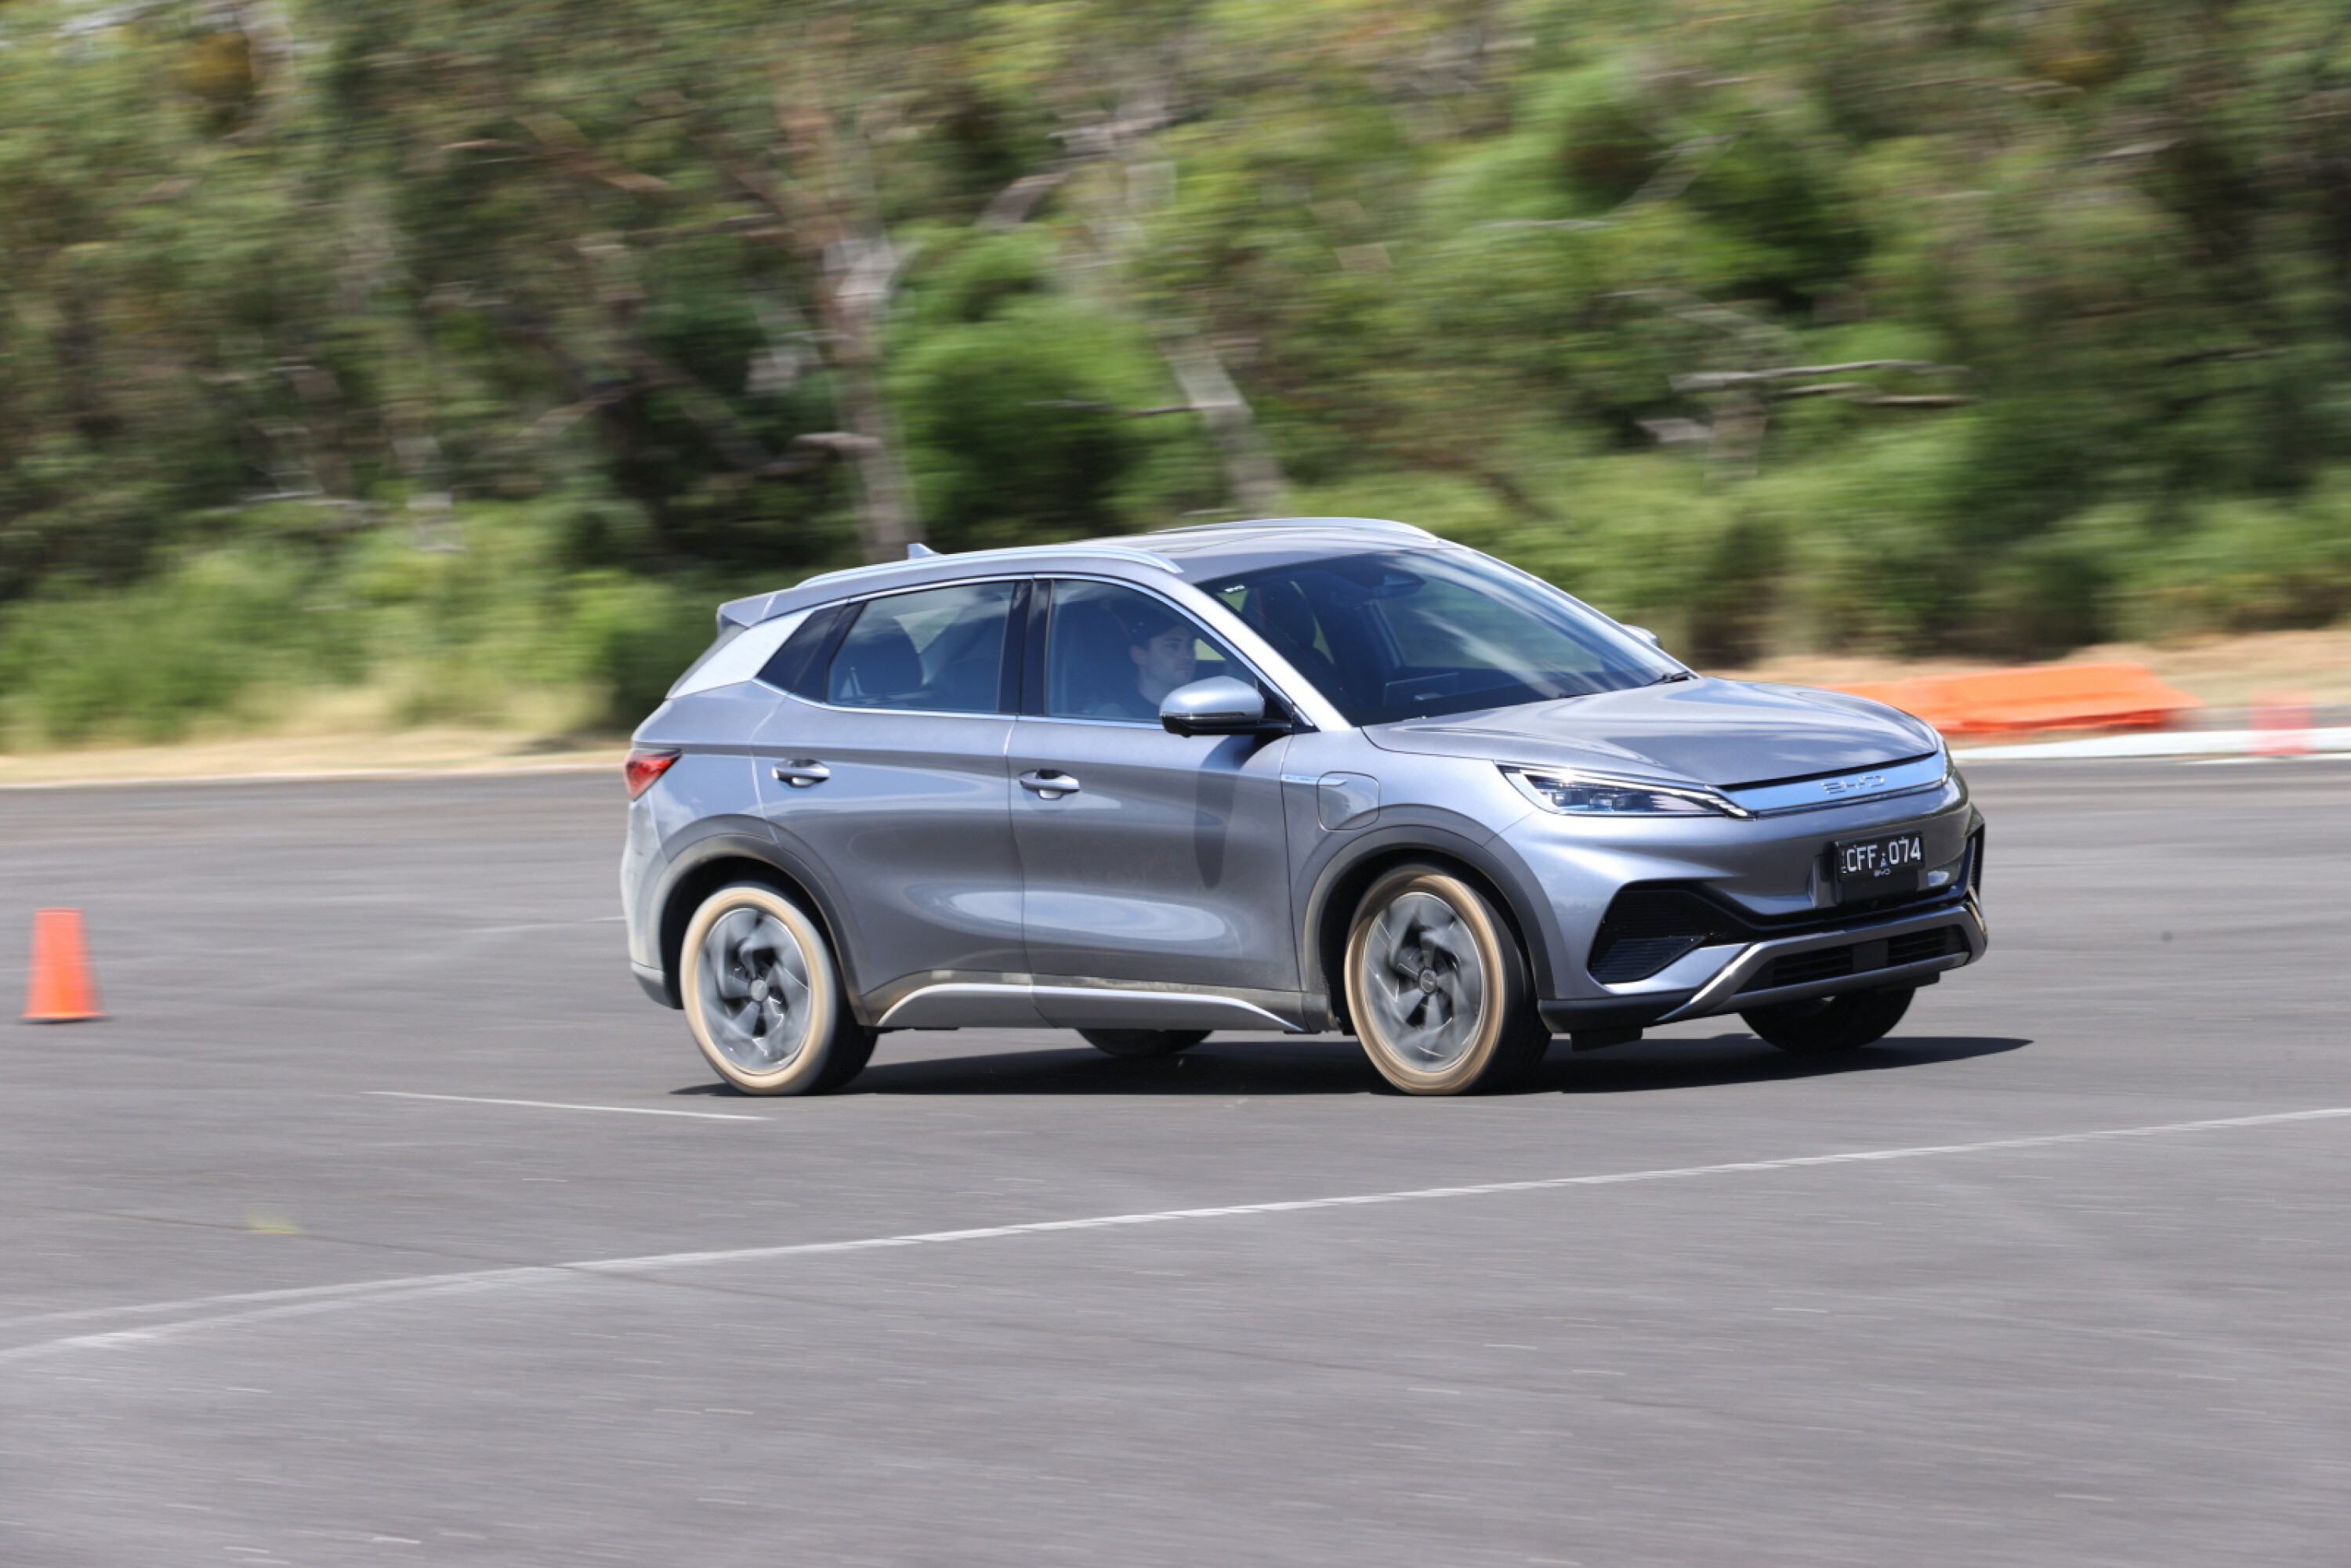
Petrol, hybrid, electric, or diesel: sales by fuel type
Unleaded was the preferred fuel type with 48,236 new petrol cars registered in July.
The share of petrol cars has increased by 7.0% year-to-date while second-place diesel has slipped by 5.0% to 27,791 as private passenger car and SUV buyers turn away from the thicker fuel.
In July, Australians bought more new hybrid vehicles than pure EVs, bucking the trend of the last few months. PHEV made up the smallest share in the market, with 834 sales – though it’s still a 24.1% improvement year-to-date.
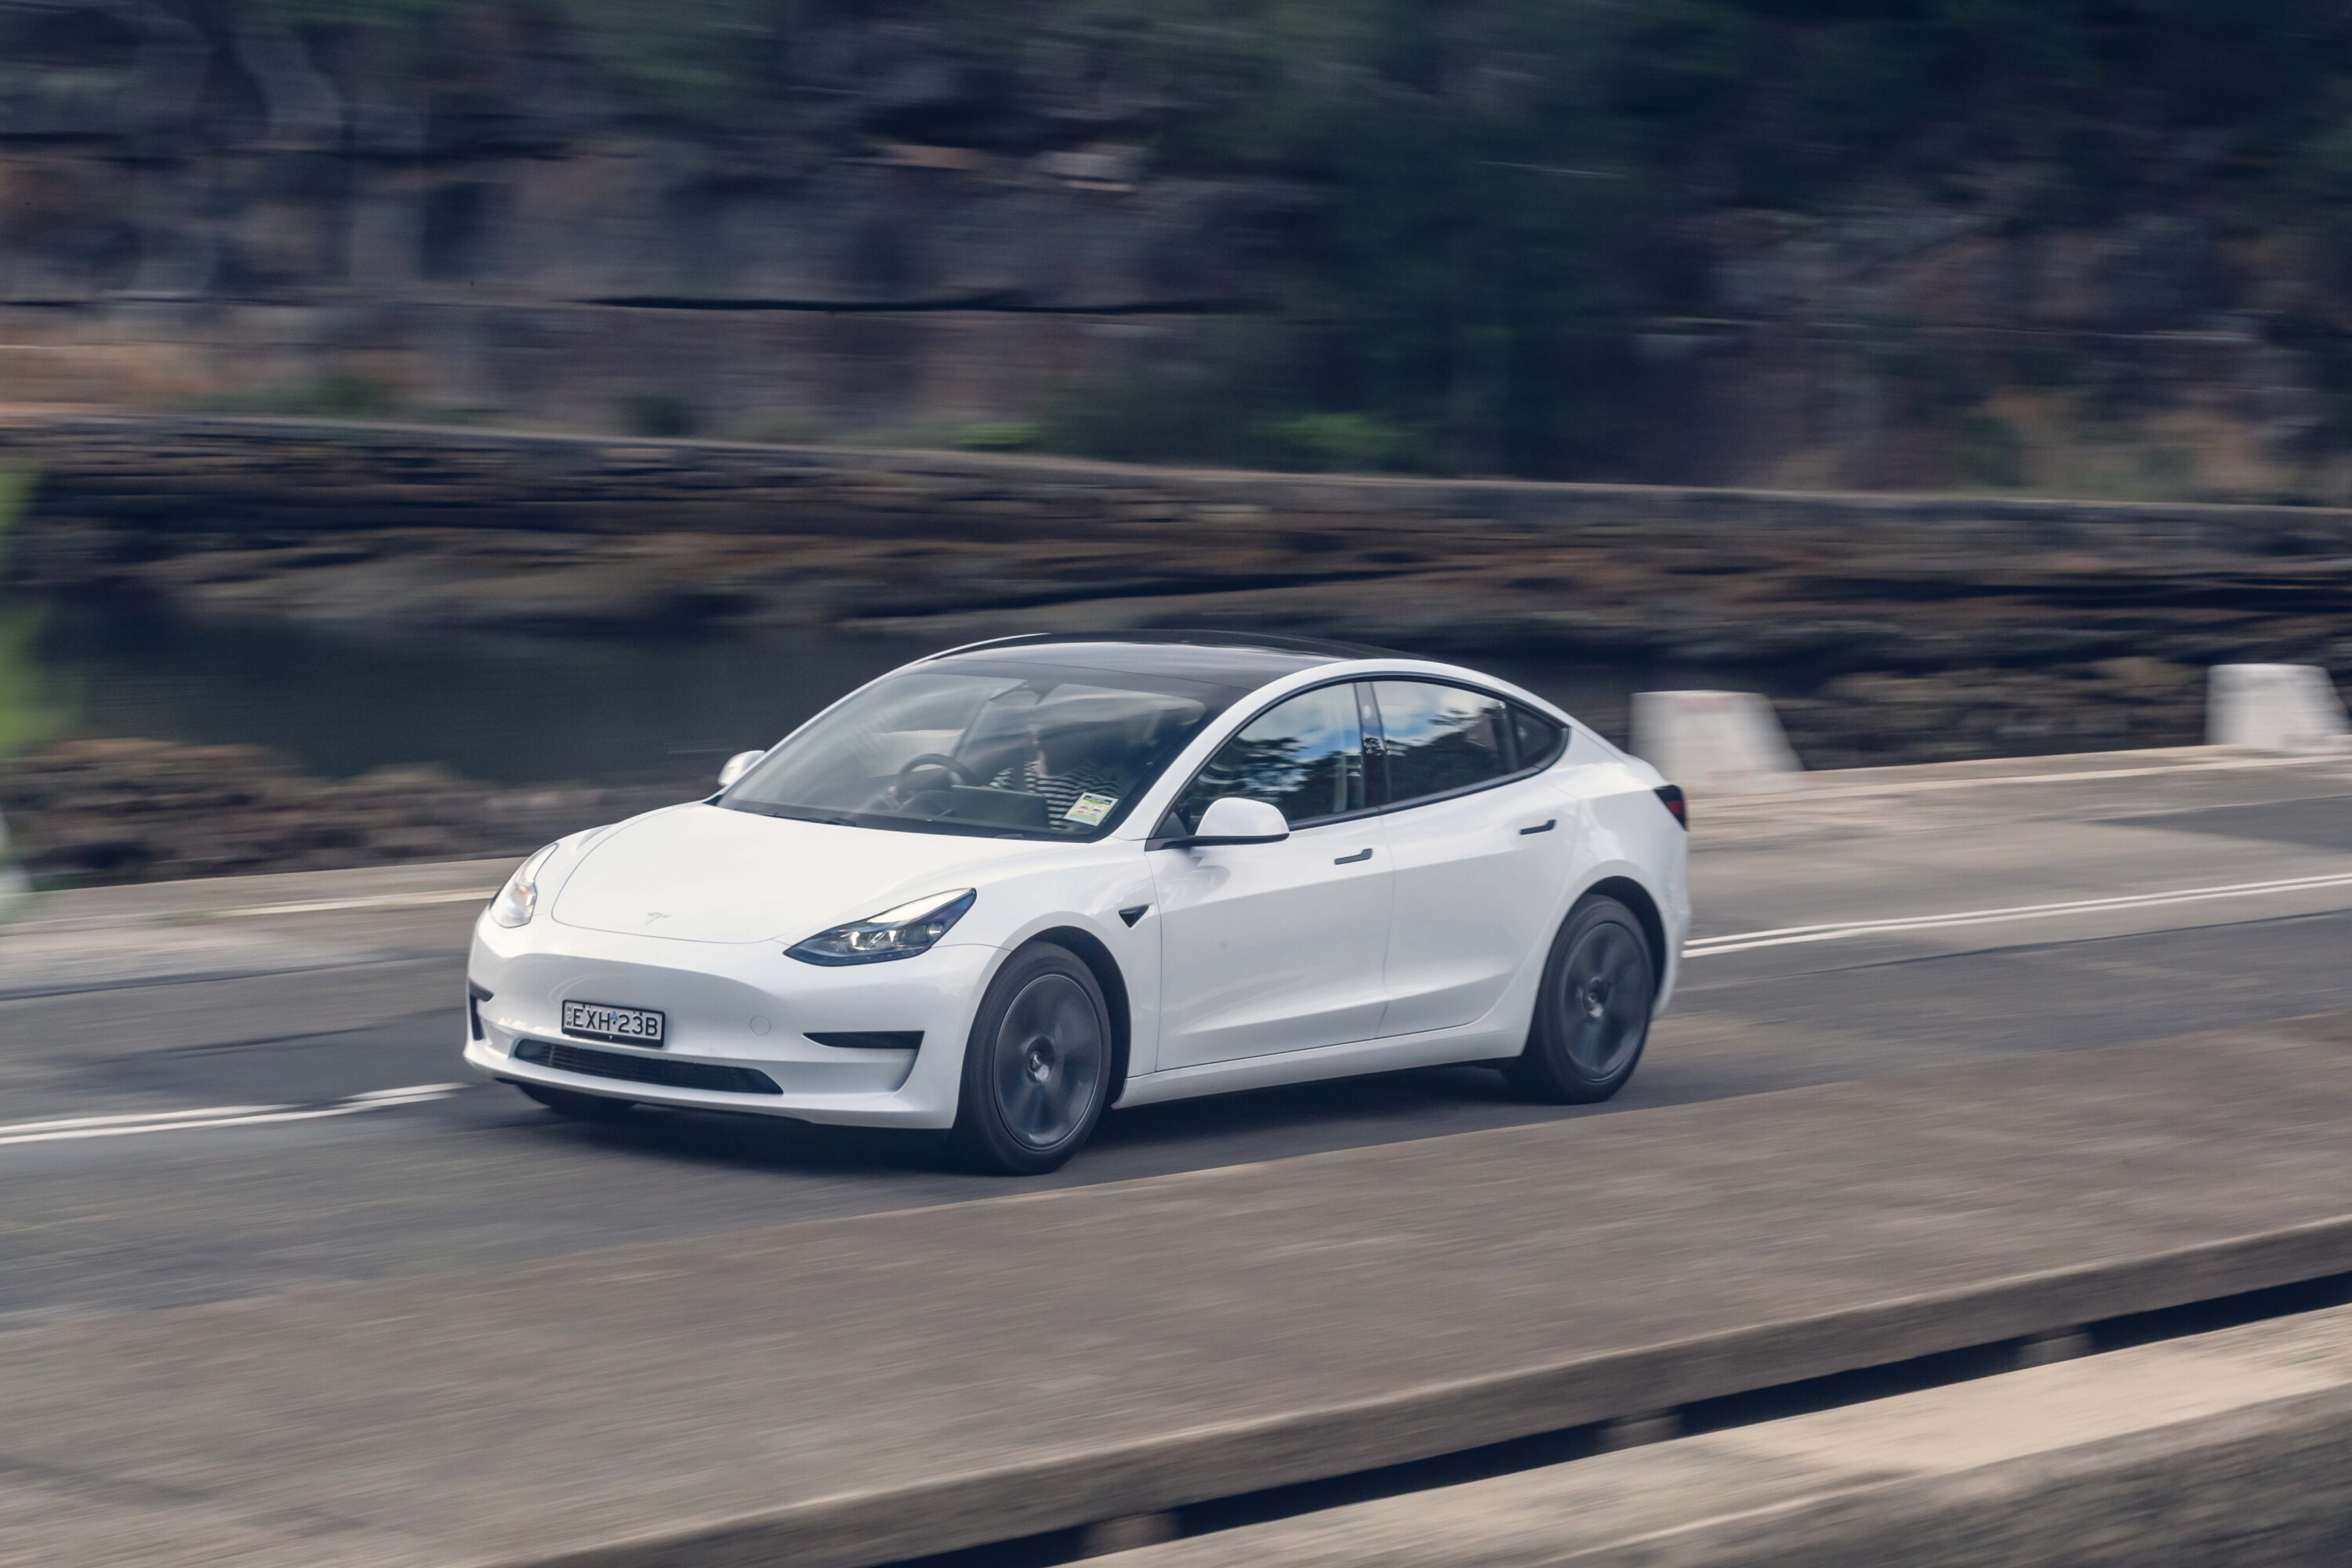
In tables: New car sales by fuel type for July 2023
| Table Contents | ||||||
|---|---|---|---|---|---|---|
| Fuel type | Jul-23 | Jul-22 | YTD 23 | YTD 22 | Variance (month) | Variance (YTD) |
| Petrol | 48,236 | 44,035 | 342,525 | 320,146 | 9.50% | 7.00% |
| Diesel | 27,791 | 28,785 | 203,730 | 214,476 | -3.50% | -5.00% |
| Hybrid | 9696 | 6783 | 48,009 | 47,857 | 42.90% | 0.30% |
| Electric | 6846 | 609 | 49,938 | 10,289 | 999%”}”>>999% | 385.40% |
| PHEV | 834 | 578 | 4366 | 3519 | 44.30% | 24.10% |
| Hydrogen | 0 | 1 | 0 | 10 | -100.00% | -100.00% |
Country of Origin: Where Australia’s new cars came from in July 2023
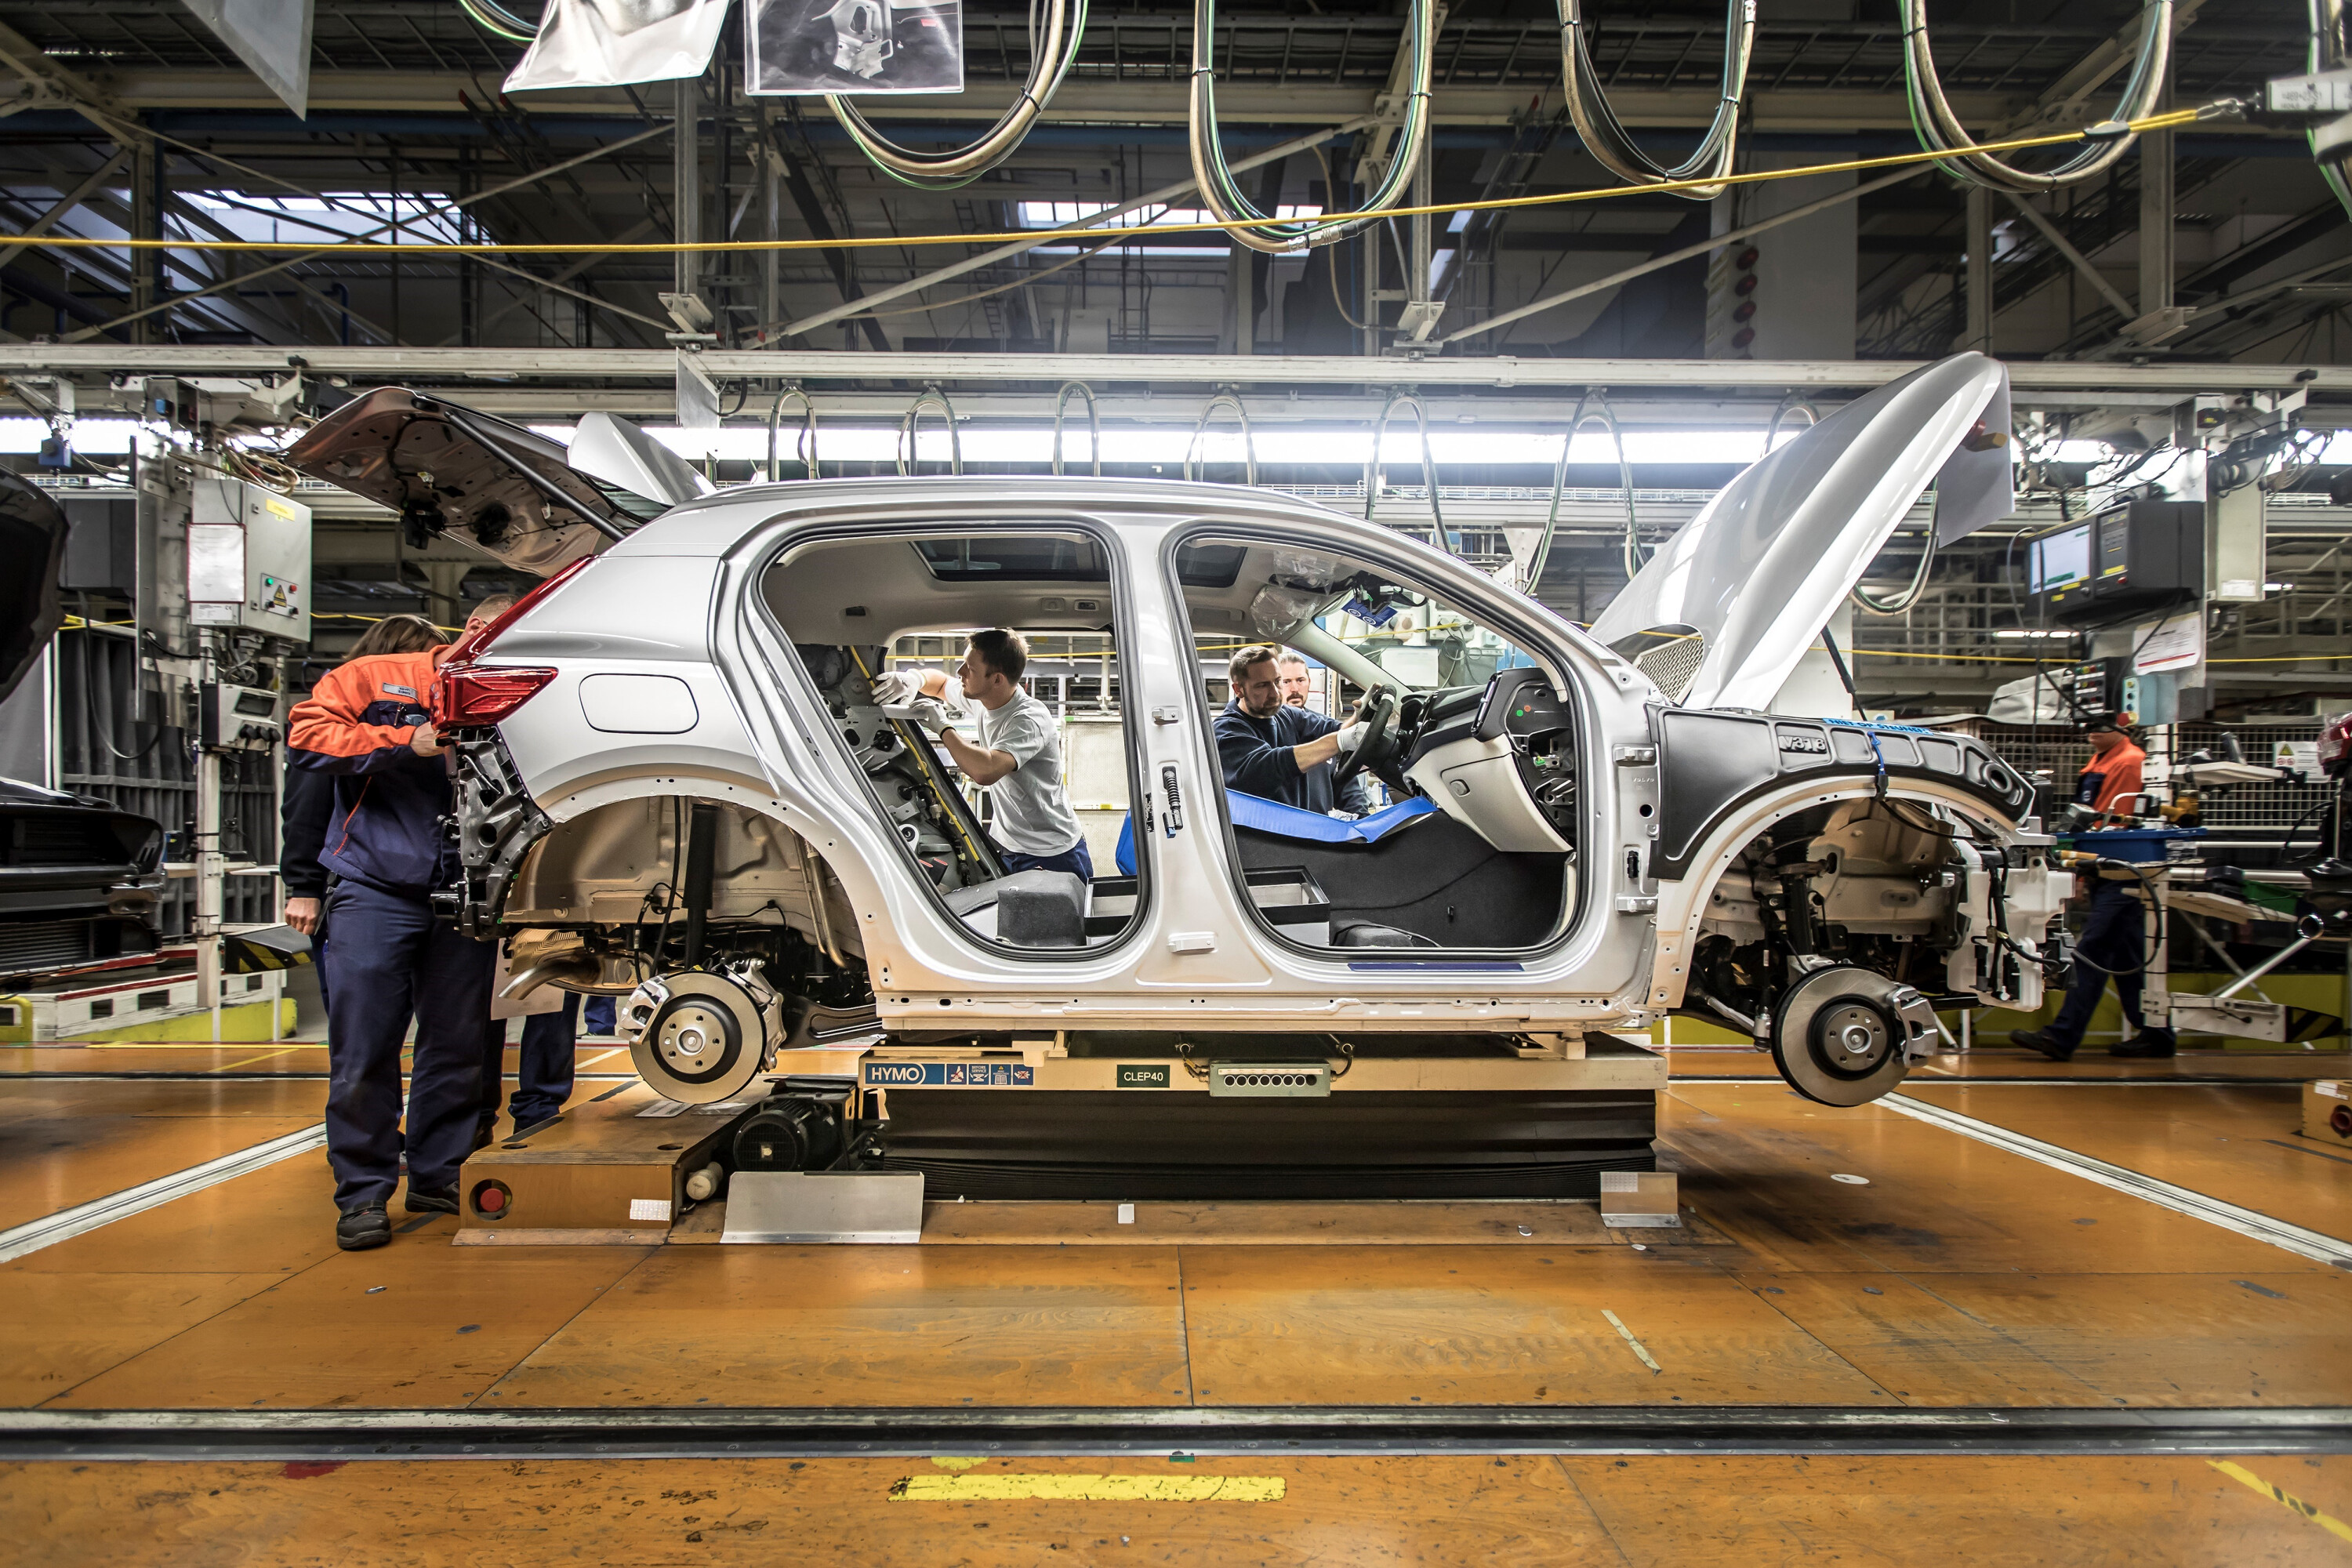
Australians continue our love affair with Japanese vehicles, the car-making giant accounting for 28,738 sales last month.
Thailand – the world’s one-tonne ute capital – came in second position increasing its share 6.9%, but it’s China that’s making real inroads.
Australians drove home 15,853 Chinese-built cars last month, making it the third-biggest producer. Its climb over last July is a significant 130.1%, with a year-to-date delivery increase of 97.1 per cent.
| Rank | Country of origin | Jul-23 | Jul-22 | YTD 23 | YTD 22 |
|---|---|---|---|---|---|
| 1 | Japan | 28,738 | 25,812 | 183,385 | 198,152 |
| 2 | Thailand | 20,086 | 18,788 | 142,386 | 144,520 |
| 3 | China | 15,853 | 6889 | 111,705 | 56,540 |
| 4 | Korea | 13,469 | 14,142 | 96,467 | 95,287 |
| 5 | Germany | 4796 | 3797 | 30,851 | 24,145 |
| 6 | USA | 3030 | 4165 | 22,295 | 22,167 |
| 7 | Other | 2636 | 2877 | 23,421 | 20,612 |
| 8 | England | 1431 | 647 | 10,240 | 5626 |
| 9 | Spain | 1041 | 936 | 8684 | 6704 |
| 10 | Mexico | 941 | 687 | 9615 | 7195 |
In charts ?
July 2023 – Top 20 models
July 2023 – Top 10 brands
July 2023 – Overall segment sales
July 2023 – Category sales
July 2023 – sales map
July 2023 – buyer type
July 2023 – Model sales race
We recommend
-
 News
NewsThese were Australia's top 10 best-selling cars in 2023
It's no surprise that Australians love the Toyota HiLux and Ford Ranger, but rising EV demand and supply constraints wrote an interesting tale for the nation's top 10 best-selling cars in 2023
-
 News
NewsAustralia's most popular electric cars in 2023
The results are in: Australians purchased more EVs than ever in 2023 and Tesla ruled the roost
-
 News
News2025 New Car Calendar: All the new cars coming to Australia
Take a look at our list of what is expected to launch in Australia in 2025 – plus those we might not see locally just yet

